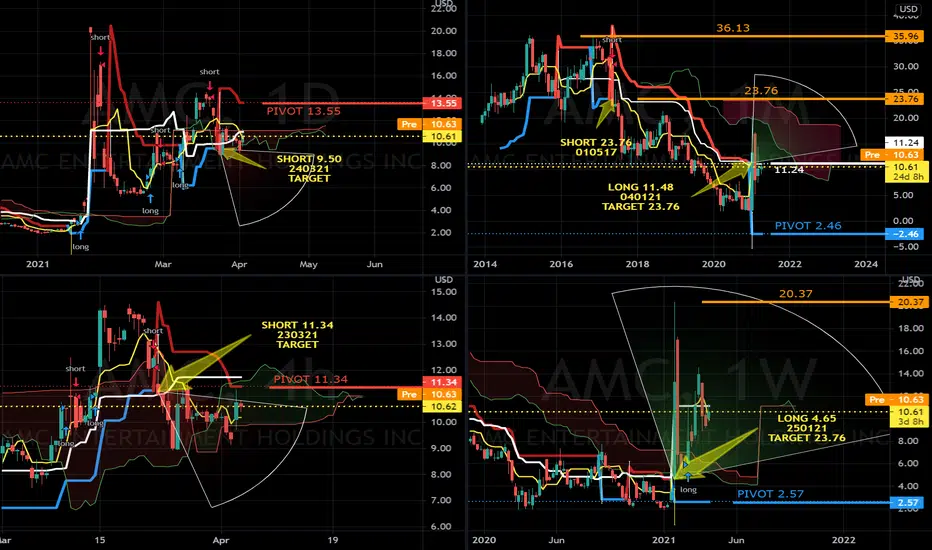
AMC hit an intraday high of $36.13 on 020315 and dropped to $2.00 on the 040121. The stock has been in a downtrend for 4 years since 010517 and is now looking for a recovery bounce since the monthly downtrend supertrend line was broken on 040121 at $11.24. Medium term long signal on 250121 at $4.65 targets $23.76 for a recovery bounce.
Current short term signals are in play since 240321 at the $9.50 level which may test the SSSA line on the weekly cloud at the $6.00 mark.
LONG TERM UPTREND SINCE 040121
MEDIUM TERM UPTREND SINCE 250121
SHORT TERM DOWNTREND SINCE 240321
PIVOT 13.55
Short positions below 13.55 to test 6.00 and 2.57
Long positions above 13.55 to test 20.37 and 23.76
Quant Strategic Singapore
면책사항
이 정보와 게시물은 TradingView에서 제공하거나 보증하는 금융, 투자, 거래 또는 기타 유형의 조언이나 권고 사항을 의미하거나 구성하지 않습니다. 자세한 내용은 이용 약관을 참고하세요.
Quant Strategic Singapore
면책사항
이 정보와 게시물은 TradingView에서 제공하거나 보증하는 금융, 투자, 거래 또는 기타 유형의 조언이나 권고 사항을 의미하거나 구성하지 않습니다. 자세한 내용은 이용 약관을 참고하세요.