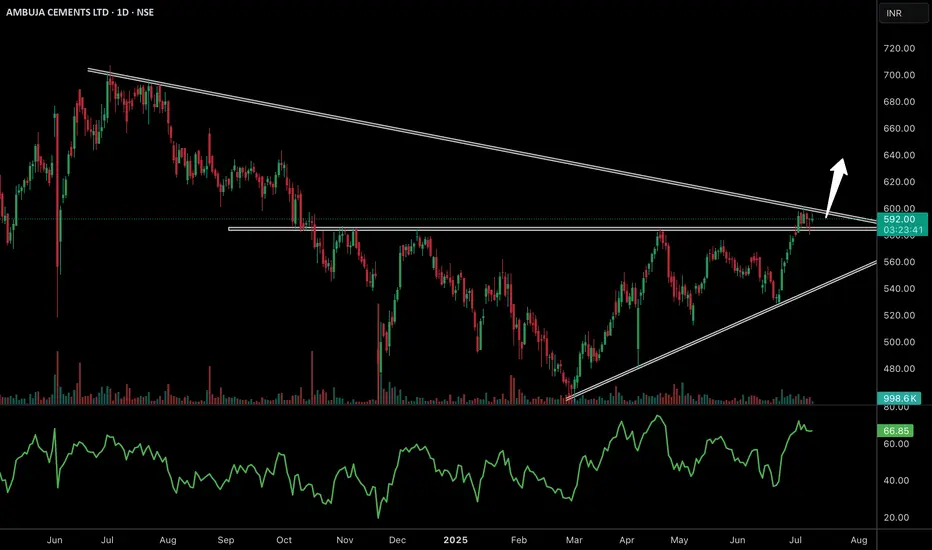
✅ Ambuja Cements is trading within a large symmetrical triangle on the daily chart and is now testing the upper trendline near 590–600, a key breakout zone that has acted as resistance multiple times.
✅ The stock is holding well above its previous horizontal resistance around 570, which now acts as a strong support base, indicating buyers are defending levels aggressively.
✅ RSI is near 66, showing good bullish momentum and plenty of room for further upside if a breakout occurs with strong volume.
✅ Volume remains steady; a clear surge above average during the breakout can trigger a sharp move towards the next resistance zone near 630–650.
📈 Watch for a sustained daily close above 600. If confirmed, Ambuja may see a fresh uptrend supported by strong fundamentals in the cement sector.
Join our community in telegram for real time updates --- telegram.me/marketiik
Telegram- telegram.me/marketiik
A simple trader, distancing from the fake crowd. Simplifying complexity, I prioritize genuine insights over trends.
Telegram- telegram.me/marketiik
A simple trader, distancing from the fake crowd. Simplifying complexity, I prioritize genuine insights over trends.
면책사항
이 정보와 게시물은 TradingView에서 제공하거나 보증하는 금융, 투자, 거래 또는 기타 유형의 조언이나 권고 사항을 의미하거나 구성하지 않습니다. 자세한 내용은 이용 약관을 참고하세요.