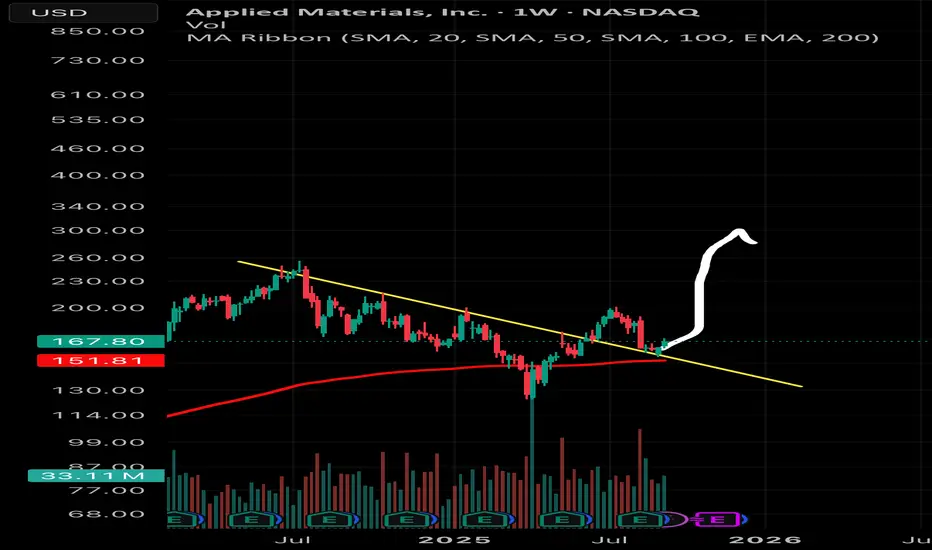
AMAT , Weekly candle, Seemingly closed foolishly around The support of accumulation trendline drawn as yellow line.
Just above the 200 weekly EMA
It seems like my prayer might be playing out
Let’s see how how it goes from now
Just above the 200 weekly EMA
It seems like my prayer might be playing out
Let’s see how how it goes from now
면책사항
이 정보와 게시물은 TradingView에서 제공하거나 보증하는 금융, 투자, 거래 또는 기타 유형의 조언이나 권고 사항을 의미하거나 구성하지 않습니다. 자세한 내용은 이용 약관을 참고하세요.
면책사항
이 정보와 게시물은 TradingView에서 제공하거나 보증하는 금융, 투자, 거래 또는 기타 유형의 조언이나 권고 사항을 의미하거나 구성하지 않습니다. 자세한 내용은 이용 약관을 참고하세요.