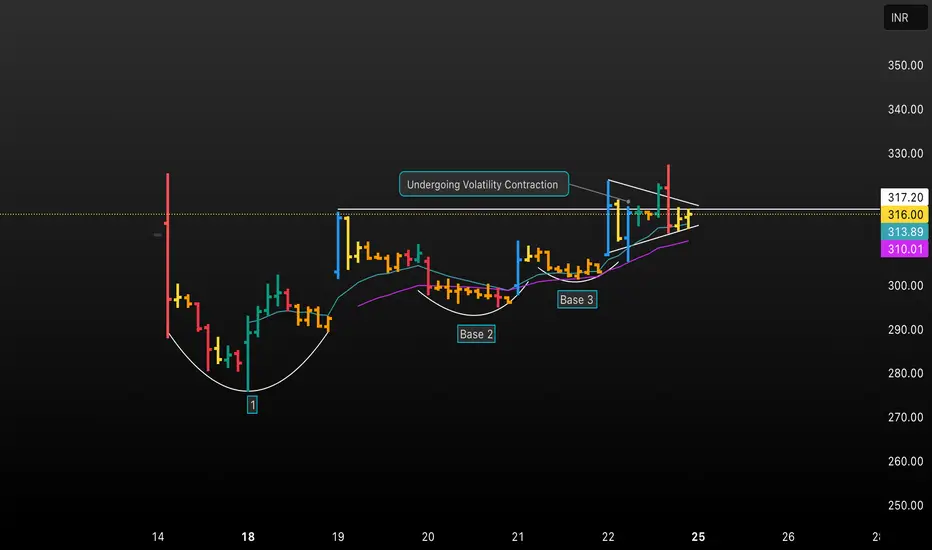
Unlock a detailed analysis of volatility contraction in this TradingView chart! Discover how price stabilizes through three distinct bases, undergoes steady consolidation, and prepares for a breakout. This educational chart highlights key phases, trendlines, and technical signals to help traders identify high-probability entry points using volatility contraction patterns. Ideal for those seeking actionable insights and trading strategy refinement.
면책사항
이 정보와 게시물은 TradingView에서 제공하거나 보증하는 금융, 투자, 거래 또는 기타 유형의 조언이나 권고 사항을 의미하거나 구성하지 않습니다. 자세한 내용은 이용 약관을 참고하세요.
면책사항
이 정보와 게시물은 TradingView에서 제공하거나 보증하는 금융, 투자, 거래 또는 기타 유형의 조언이나 권고 사항을 의미하거나 구성하지 않습니다. 자세한 내용은 이용 약관을 참고하세요.