tradingview.com/chart/nSeV9PgK/
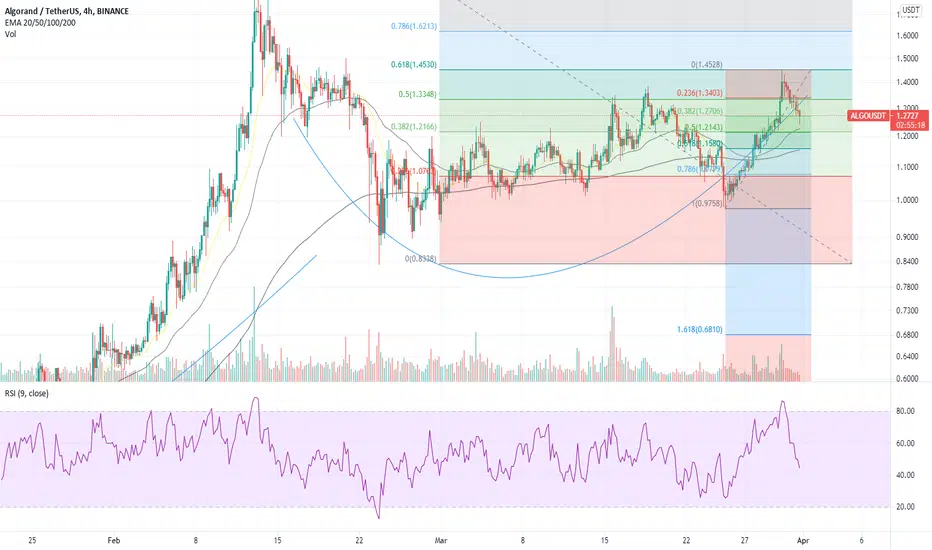
Fib retracement underway. Check if support at 0.382 or 0.5 of the retracement. Plenty of gas for bulls to run after the retracement as seen on volume in green rallies and decreasing volume in the red candles. if price goes below 0.618 indicates end of rally. Look for support first and establish support at the region.
Oh FYI on weekly chart a cup and handle was formed however still waiting to break the 12th Feb highs. On watchlist for the moment.
면책사항
이 정보와 게시물은 TradingView에서 제공하거나 보증하는 금융, 투자, 거래 또는 기타 유형의 조언이나 권고 사항을 의미하거나 구성하지 않습니다. 자세한 내용은 이용 약관을 참고하세요.
면책사항
이 정보와 게시물은 TradingView에서 제공하거나 보증하는 금융, 투자, 거래 또는 기타 유형의 조언이나 권고 사항을 의미하거나 구성하지 않습니다. 자세한 내용은 이용 약관을 참고하세요.