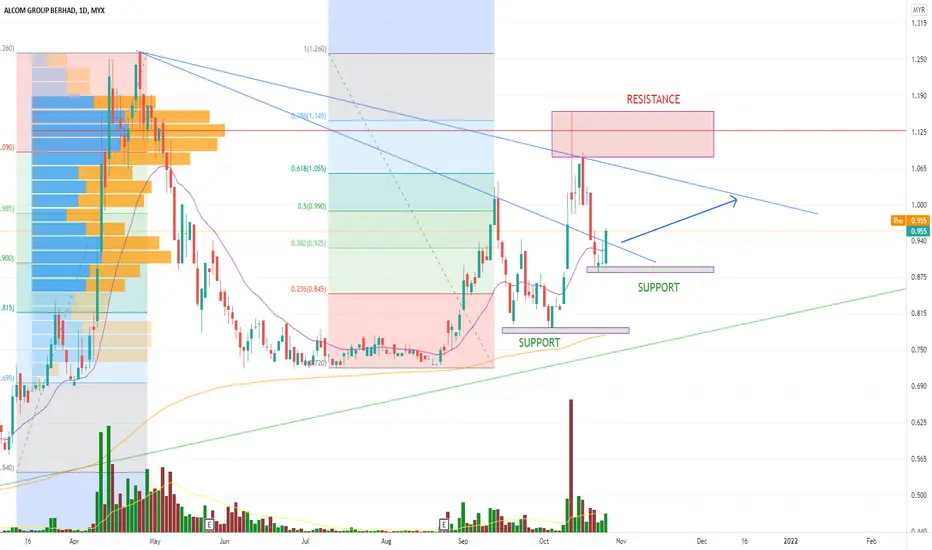
Technical analysis for ALCOM Stock based on Trend Analysis, Chart Pattern and Fibonacci Retracement
노트
Current price candle has break the immediate support line. Price candle 8 Nov 21 show Demand Test Candle with low volume-positive result. Price may move lower to next support line at 0.790.거래청산: 스탑 닿음
This stock lost momentum, don' take position in this stockAHI
면책사항
이 정보와 게시물은 TradingView에서 제공하거나 보증하는 금융, 투자, 거래 또는 기타 유형의 조언이나 권고 사항을 의미하거나 구성하지 않습니다. 자세한 내용은 이용 약관을 참고하세요.
AHI
면책사항
이 정보와 게시물은 TradingView에서 제공하거나 보증하는 금융, 투자, 거래 또는 기타 유형의 조언이나 권고 사항을 의미하거나 구성하지 않습니다. 자세한 내용은 이용 약관을 참고하세요.