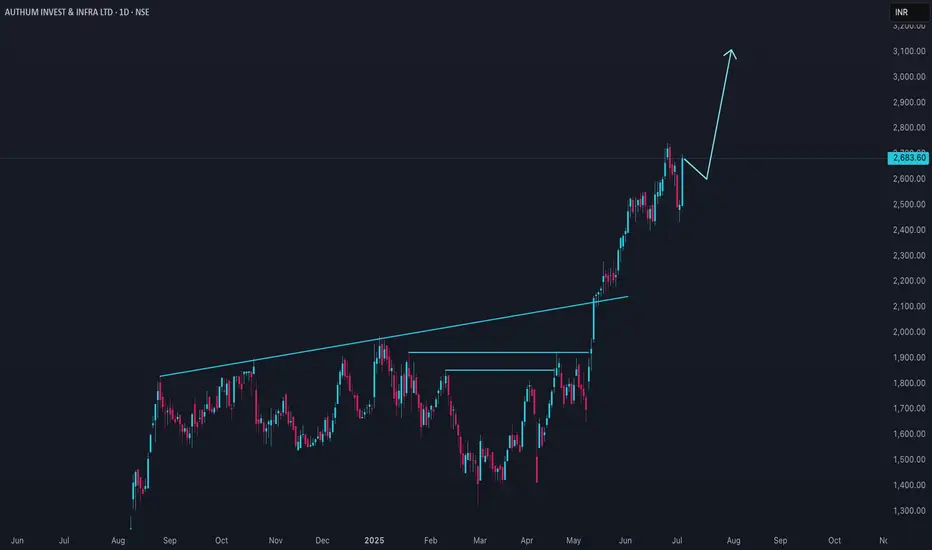
Authum Investment & Infrastructure Ltd (AIIL) has shown significant price appreciation over the past year, rising by more than 120%. The stock recently reached an all-time high near ₹2,600, with its lowest point in the past year being around ₹730. In the last month, AIIL gained over 17%, and in the past week alone, it rose by more than 6%.
The stock is considered volatile, with price swings that are sharper than the broader market. Technical indicators, such as moving averages, generally point to a bullish trend, with the short-term average staying above the long-term average. However, there have been recent signals of a possible short-term correction, including a minor sell indication from the MACD and a pivot top formation. Key support levels to watch are around ₹2,440 and ₹2,050; a drop below these could suggest further downside.
Trading volumes have increased as the price moved higher, which is typically a positive technical sign. The company’s fundamentals remain strong, with a high promoter holding and steady dividend payouts, although the dividend yield is low. Overall, AIIL’s trend remains positive, but the stock’s high volatility means that price corrections can be sharp, and investors should manage risk accordingly.
면책사항
이 정보와 게시물은 TradingView에서 제공하거나 보증하는 금융, 투자, 거래 또는 기타 유형의 조언이나 권고 사항을 의미하거나 구성하지 않습니다. 자세한 내용은 이용 약관을 참고하세요.
면책사항
이 정보와 게시물은 TradingView에서 제공하거나 보증하는 금융, 투자, 거래 또는 기타 유형의 조언이나 권고 사항을 의미하거나 구성하지 않습니다. 자세한 내용은 이용 약관을 참고하세요.