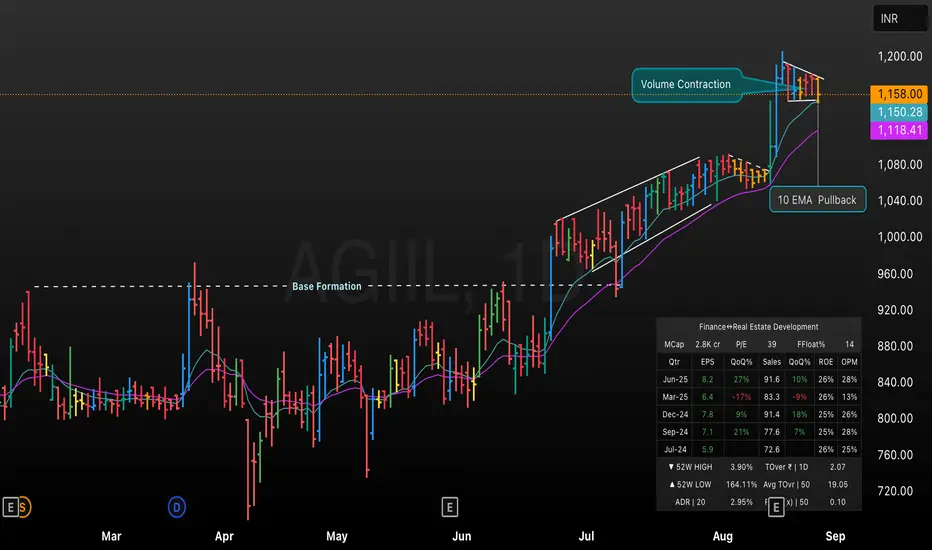
This TradingView chart showcases AGIIL’s technical progression from a prolonged base formation to a strong breakout phase, supported by notable volume contraction and a textbook 10 EMA pullback. Key chart highlights include identification of base formation, a rising price channel, and consolidation with EMA support. The volume contraction and recent price pullback to the 10 EMA reflect a healthy setup typically seen before sustained upward movement, making AGIIL a candidate for breakout trade strategies. Core metrics such as market cap, EPS growth, 52-week range, and liquidity are also visually summarized for quick reference.
면책사항
이 정보와 게시물은 TradingView에서 제공하거나 보증하는 금융, 투자, 거래 또는 기타 유형의 조언이나 권고 사항을 의미하거나 구성하지 않습니다. 자세한 내용은 이용 약관을 참고하세요.
면책사항
이 정보와 게시물은 TradingView에서 제공하거나 보증하는 금융, 투자, 거래 또는 기타 유형의 조언이나 권고 사항을 의미하거나 구성하지 않습니다. 자세한 내용은 이용 약관을 참고하세요.