(AFDI)
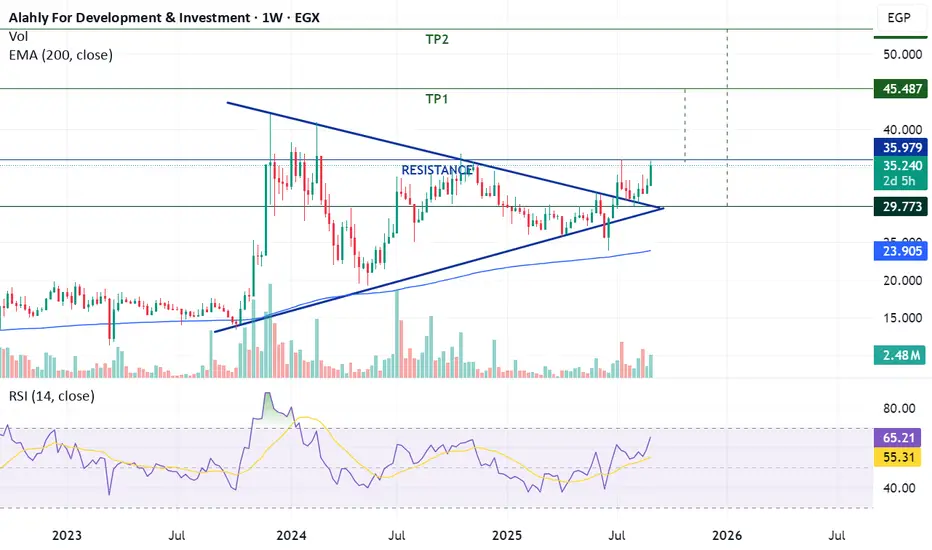
The stock previously formed a symmetrical triangle, which was successfully broken on July 9. On the weekly chart, a clear Cup & Handle pattern has also developed.
If the price breaks above 35.8 and sustains, this would validate the pattern and open the way for the following medium- to long-term targets: 45 – 53.
⚠ The stop-loss level after a confirmed breakout is set at 35.5.
Trade Setup:
-Stock Code: AFDI
-Potential Buy Range: 35.8 – 36.8
-Target Price 1 (TP1): 45
-Target Price 2 (TP2): 53
-Stop-Loss (SL): 35.5 after breakout
면책사항
해당 정보와 게시물은 금융, 투자, 트레이딩 또는 기타 유형의 조언이나 권장 사항으로 간주되지 않으며, 트레이딩뷰에서 제공하거나 보증하는 것이 아닙니다. 자세한 내용은 이용 약관을 참조하세요.
면책사항
해당 정보와 게시물은 금융, 투자, 트레이딩 또는 기타 유형의 조언이나 권장 사항으로 간주되지 않으며, 트레이딩뷰에서 제공하거나 보증하는 것이 아닙니다. 자세한 내용은 이용 약관을 참조하세요.