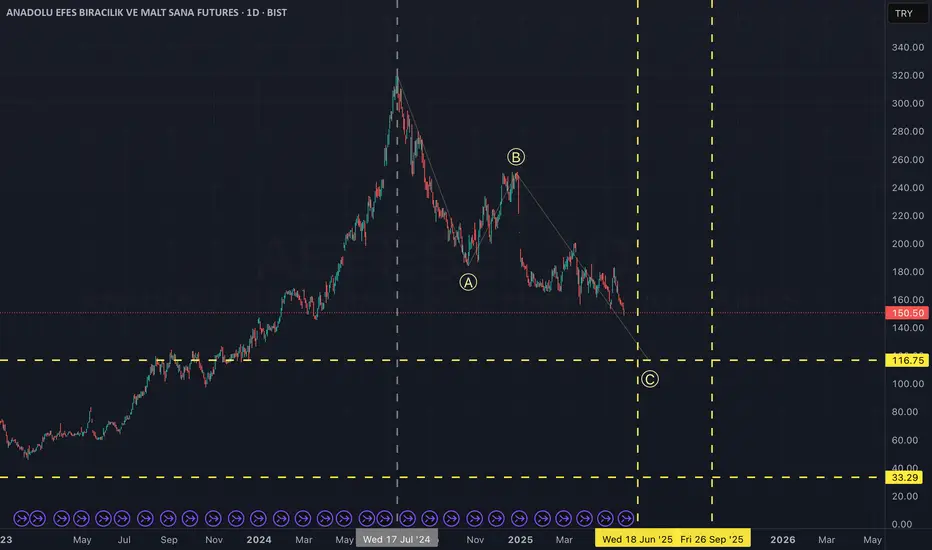
Ee observed an all-time high on July 17, 2025. Since then, the market appears to be undergoing an ABC corrective pattern. Based on the wave structure and proportions, it seems we are currently in the final leg of this correction.
Two potential target zones, both in terms of price and timing, are marked with yellow lines on the chart. In my view, there is a high probability that the correction will conclude before June 18. However, if the final leg deepens further than expected, the completion of this corrective phase could be extended into September.
Two potential target zones, both in terms of price and timing, are marked with yellow lines on the chart. In my view, there is a high probability that the correction will conclude before June 18. However, if the final leg deepens further than expected, the completion of this corrective phase could be extended into September.
액티브 트레이드
Since the chart on May 29, with the latest wave starting to take shape, I'm updating the potential reversal zones as shown in the chart. While the gray areas are less probable zones, it's still worth keeping an eye on them.면책사항
해당 정보와 게시물은 금융, 투자, 트레이딩 또는 기타 유형의 조언이나 권장 사항으로 간주되지 않으며, 트레이딩뷰에서 제공하거나 보증하는 것이 아닙니다. 자세한 내용은 이용 약관을 참조하세요.
면책사항
해당 정보와 게시물은 금융, 투자, 트레이딩 또는 기타 유형의 조언이나 권장 사항으로 간주되지 않으며, 트레이딩뷰에서 제공하거나 보증하는 것이 아닙니다. 자세한 내용은 이용 약관을 참조하세요.