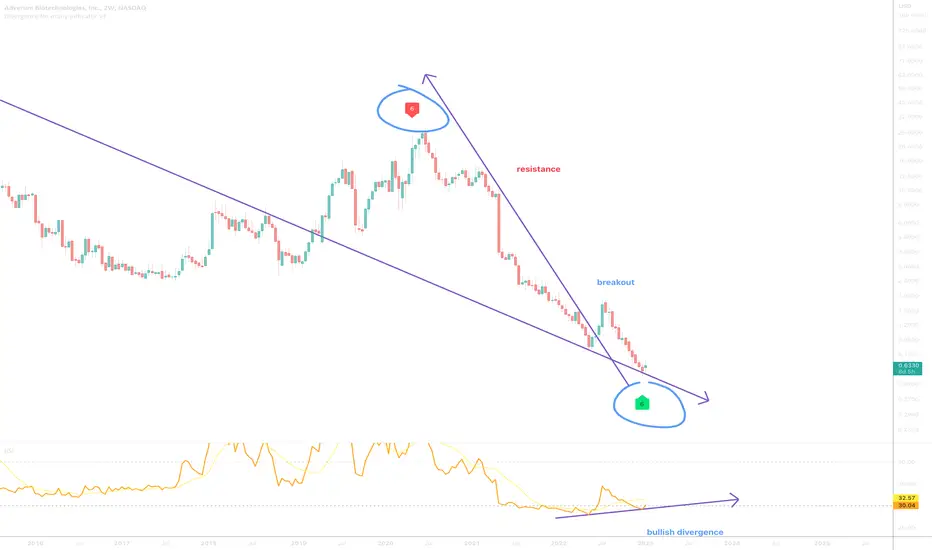
On the above bi-Weekly chart price action has corrected over 90% since June 2020. A number of reasons now exist to be bullish , including:
1) A strong buy signal prints (not shown).
2) Regular bullish divergence . Multiple oscillators printing divergence.
3) Price action confirms support on past resistance.
4) Falling wedge breakout + backtest.
Is it possible price action falls further? Sure.
Is it probable? No.
Ww
Type: trade
Risk: <=6% of portfolio
Timeframe: Don’t know.
Return: Don’t know
Stop loss: <= 50 cents
액티브 트레이드
노트
support confirmed액티브 트레이드
GRM support confirmed.노트
50% return so far. Hold until the resistance @ 7 dollars.액티브 트레이드
GRM support confirmed three times now. More bullish than a bull on steroids running on a moving treadmill chasing a slow moving red flag.노트
230% return so far? Time to sell... If only there was a way to tell.액티브 트레이드
면책사항
해당 정보와 게시물은 금융, 투자, 트레이딩 또는 기타 유형의 조언이나 권장 사항으로 간주되지 않으며, 트레이딩뷰에서 제공하거나 보증하는 것이 아닙니다. 자세한 내용은 이용 약관을 참조하세요.
면책사항
해당 정보와 게시물은 금융, 투자, 트레이딩 또는 기타 유형의 조언이나 권장 사항으로 간주되지 않으며, 트레이딩뷰에서 제공하거나 보증하는 것이 아닙니다. 자세한 내용은 이용 약관을 참조하세요.