Greetings Traders,
Today, we’re taking a closer look at ADIB (Abu Dhabi Islamic Bank) — an interesting setup forming on the chart!
Key Highlights:
Keep an eye on volume during the breakout — confirmation is key.
Happy Trading & Stay Disciplined!
Today, we’re taking a closer look at ADIB (Abu Dhabi Islamic Bank) — an interesting setup forming on the chart!
Key Highlights:
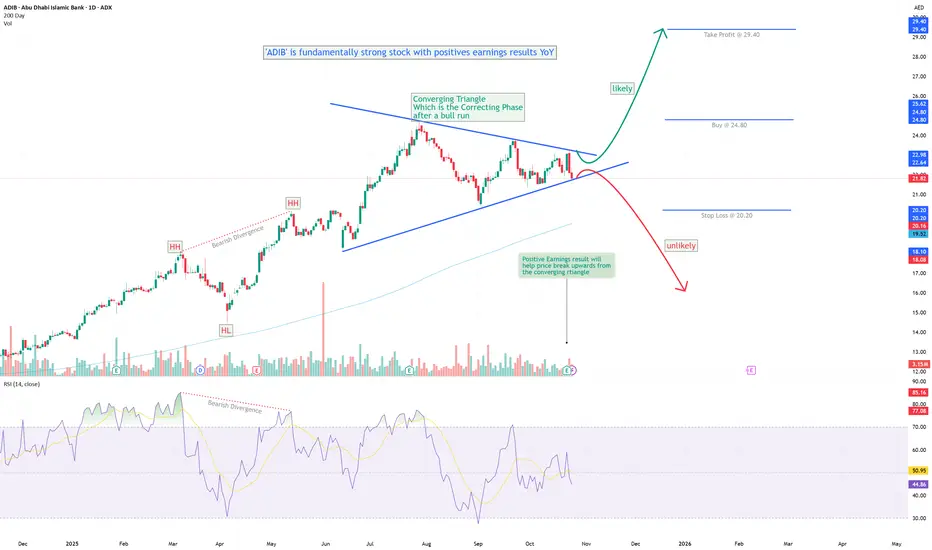
- Fundamentally strong: ADIB continues to deliver solid YoY earnings growth.
- Bearish divergence was observed earlier, leading to strong selling pressure, followed by the formation of a converging triangle pattern.
- This triangle appears to represent a corrective phase after a prolonged bullish rally.
- The stock recently announced positive earnings results, reinforcing the underlying strength.
- Considering the technical and fundamental setup, a bullish breakout from the triangle looks probable.
- Trading Plan: Wait for a confirmed breakout above the upper trendline before entering a cautious long position. Traders can take a risky position after break-out of triangle. And for Cautious traders wait for the breakout from the upper tip of the triangle.
- Stop Loss: Below the recent swing low.
Keep an eye on volume during the breakout — confirmation is key.
Happy Trading & Stay Disciplined!
면책사항
해당 정보와 게시물은 금융, 투자, 트레이딩 또는 기타 유형의 조언이나 권장 사항으로 간주되지 않으며, 트레이딩뷰에서 제공하거나 보증하는 것이 아닙니다. 자세한 내용은 이용 약관을 참조하세요.
면책사항
해당 정보와 게시물은 금융, 투자, 트레이딩 또는 기타 유형의 조언이나 권장 사항으로 간주되지 않으며, 트레이딩뷰에서 제공하거나 보증하는 것이 아닙니다. 자세한 내용은 이용 약관을 참조하세요.