Hello?
Traders, welcome.
If you "Follow", you can always get new information quickly.
Please also click "Boost".
Have a good day.
-------------------------------------
(ADABTC 1W chart)

It has fallen in the area where the power of the rise can be obtained.
Therefore, there is a possibility of a sharp decline, so you need to think about how to respond to it.
-------------------------------------
(ADAUSDT 1W Chart)

In order to show a mid- to long-term uptrend, it must rise above 0.3448-0.4380.
To do so, the key is whether it can be supported above 0.2772.
If not, I expect it to fall below 0.1720.
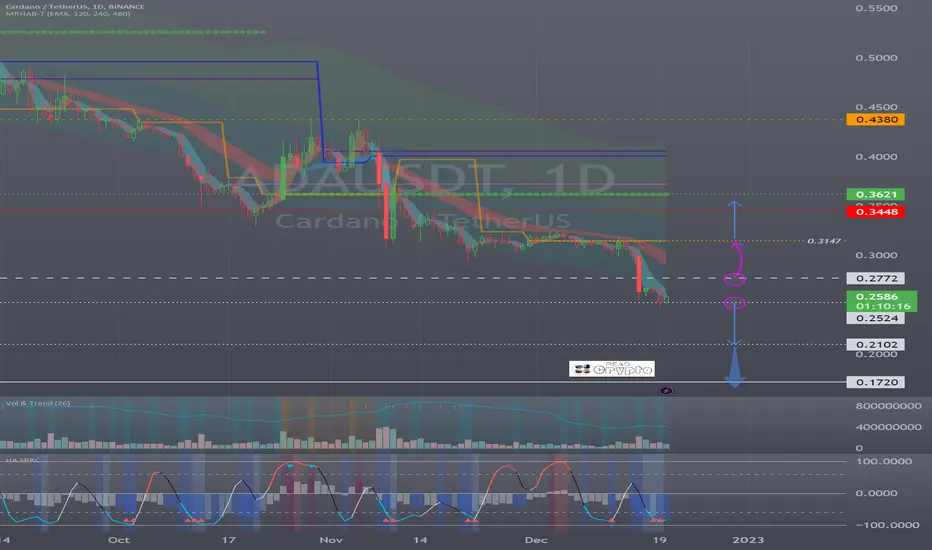
(1D chart)
The key is whether it can rise above 0.2772, which is an important volume profile section.
If not, I expect it to fall below 0.2102.
It is important if it can rise above 0.3147 to show a short-term uptrend.
As it falls below 0.2772, it is judged that it is entering the long-term investment zone.
Therefore, I think it is good to use a trading method that increases the number of coins corresponding to profit with a long breath.
-------------------------------------------------- -------------------------------------------
** All descriptions are for reference only and do not guarantee profit or loss in investment.
** If you share this chart, you can use the indicators normally.
** The MRHAB-T indicator includes indicators that indicate points of support and resistance.
** HA SRRC indicators are displayed as StochRSI (line), RSI (columns), and CCI (bgcolor).
** The CCI indicator is displayed in the overbought section (CCI > +100) and oversold section (CCI < -100).
(Short-term Stop Loss can be said to be a point where profit or loss can be preserved or additional entry can be made by split trading. This is a short-term investment perspective.)
---------------------------------
Traders, welcome.
If you "Follow", you can always get new information quickly.
Please also click "Boost".
Have a good day.
-------------------------------------
(ADABTC 1W chart)
It has fallen in the area where the power of the rise can be obtained.
Therefore, there is a possibility of a sharp decline, so you need to think about how to respond to it.
-------------------------------------
(ADAUSDT 1W Chart)
In order to show a mid- to long-term uptrend, it must rise above 0.3448-0.4380.
To do so, the key is whether it can be supported above 0.2772.
If not, I expect it to fall below 0.1720.
(1D chart)
The key is whether it can rise above 0.2772, which is an important volume profile section.
If not, I expect it to fall below 0.2102.
It is important if it can rise above 0.3147 to show a short-term uptrend.
As it falls below 0.2772, it is judged that it is entering the long-term investment zone.
Therefore, I think it is good to use a trading method that increases the number of coins corresponding to profit with a long breath.
-------------------------------------------------- -------------------------------------------
** All descriptions are for reference only and do not guarantee profit or loss in investment.
** If you share this chart, you can use the indicators normally.
** The MRHAB-T indicator includes indicators that indicate points of support and resistance.
** HA SRRC indicators are displayed as StochRSI (line), RSI (columns), and CCI (bgcolor).
** The CCI indicator is displayed in the overbought section (CCI > +100) and oversold section (CCI < -100).
(Short-term Stop Loss can be said to be a point where profit or loss can be preserved or additional entry can be made by split trading. This is a short-term investment perspective.)
---------------------------------
※ Follow X to check out the posts.
※ X를 팔로우하고 게시물을 확인하세요.
◆ t.me/readCryptoChannel
[HA-MS Indicator]
bit.ly/3YxHgvN
[OBV Indicator]
bit.ly/4dcyny3
※ X를 팔로우하고 게시물을 확인하세요.
◆ t.me/readCryptoChannel
[HA-MS Indicator]
bit.ly/3YxHgvN
[OBV Indicator]
bit.ly/4dcyny3
관련 발행물
면책사항
이 정보와 게시물은 TradingView에서 제공하거나 보증하는 금융, 투자, 거래 또는 기타 유형의 조언이나 권고 사항을 의미하거나 구성하지 않습니다. 자세한 내용은 이용 약관을 참고하세요.