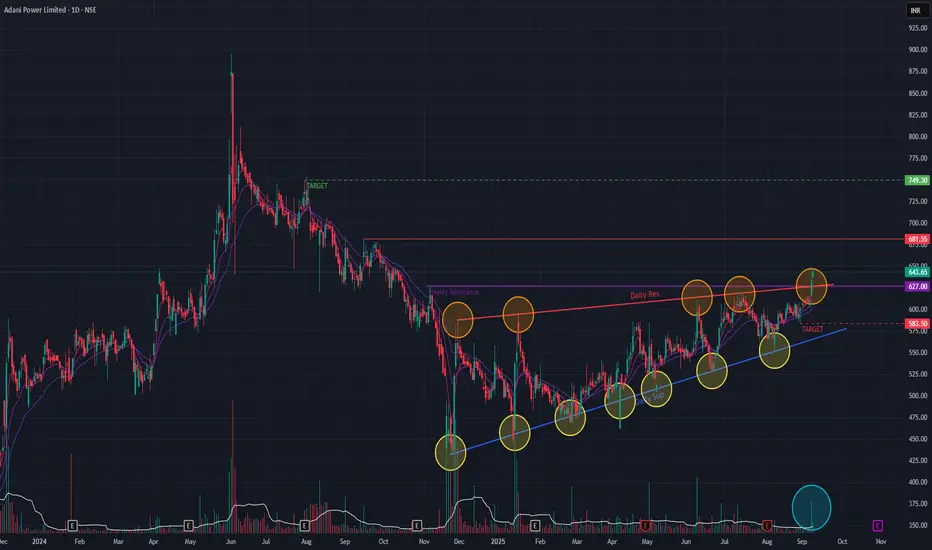
Adani Power has been in an uptrend since Nov 2024 & has formed a Triangle pattern. The past two days it has BrokenOut of the Triangle pattern with exceptionally huge volume indicating buyer interest. Short-term EMAs are in PCO state as well as the stock has breached two major resistance trendlines asserting Bullishness. A Golden Cross-over has formed since few days, indicating Bullishness
We may see levels of 749 if the momentum continues as well as a major resistance trendline is breached. It may go down to 583 levels if momentum is not sustained.
Keep monitoring the price-action !!
We may see levels of 749 if the momentum continues as well as a major resistance trendline is breached. It may go down to 583 levels if momentum is not sustained.
Keep monitoring the price-action !!
Disclaimer: This analysis is my personal view & for educational purposes only. They shall not be construed as trade or investment advice. Before making any financial decision, it is imperative that you consult with a qualified financial professional.
면책사항
해당 정보와 게시물은 금융, 투자, 트레이딩 또는 기타 유형의 조언이나 권장 사항으로 간주되지 않으며, 트레이딩뷰에서 제공하거나 보증하는 것이 아닙니다. 자세한 내용은 이용 약관을 참조하세요.