📈 Support & Resistance Levels
Classic Pivot Points:
Resistance: ₹151.20 (R1), ₹156.15 (R2), ₹159.40 (R3)
Support: ₹139.75 (S1), ₹143.00 (S2), ₹134.80 (S3)
Pivot Point: ₹147.95
Fibonacci Levels:
Resistance: ₹151.08 (R1), ₹153.02 (R2), ₹156.15 (R3)
Support: ₹142.88 (S1), ₹144.82 (S2), ₹139.75 (S3)
Pivot Point: ₹147.95
Camarilla Levels:
Resistance: ₹147.00 (R1), ₹147.75 (R2), ₹148.50 (R3)
Support: ₹144.00 (S1), ₹144.75 (S2), ₹145.50 (S3)
Pivot Point: ₹147.95
📊 Technical Indicators
RSI (14-day): 44.06 — Neutral to slightly bearish
MACD: -0.840 — Bearish trend
Moving Averages:
20-day EMA: ₹135.67 — Neutral
50-day EMA: ₹127.34 — Neutral
100-day EMA: ₹121.00 — Uptrend
200-day EMA: ₹116.62 — Uptrend
🔍 Market Sentiment
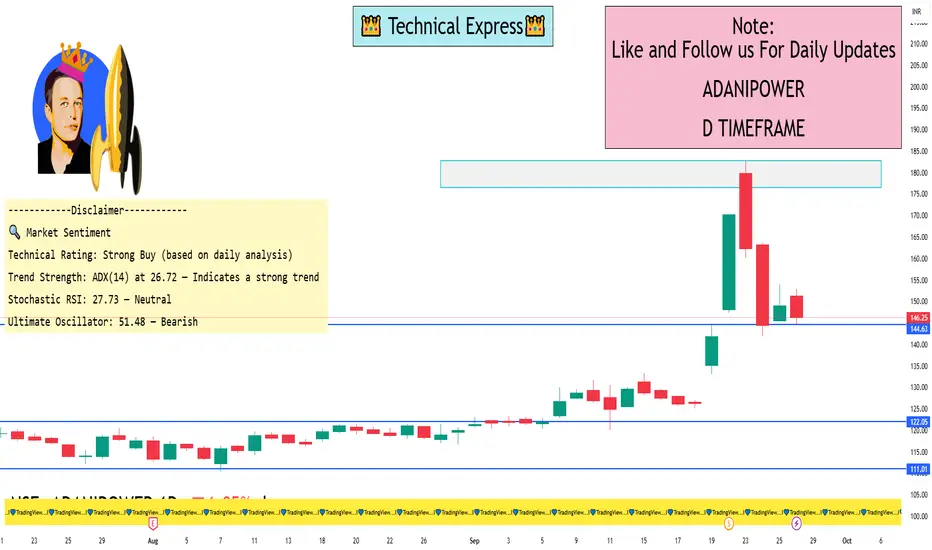
Technical Rating: Strong Buy (based on daily analysis)
Trend Strength: ADX(14) at 26.72 — Indicates a strong trend
Stochastic RSI: 27.73 — Neutral
Ultimate Oscillator: 51.48 — Bearish
📉 Recent Performance
Recent Decline: Adani Power reported a 15.5% decline in its first-quarter profit, with consolidated net earnings dropping to ₹33.05 billion from ₹39.13 billion the previous year. The decline is attributed to subdued power demand and increased coal import costs
📌 Conclusion
Adani Power is currently in a neutral to slightly bearish phase on the daily chart, with key support around ₹139.75 and resistance near ₹151.20. The technical indicators suggest a cautious outlook, with the RSI and MACD indicating a bearish trend. However, the strong trend strength (ADX) and positive moving averages indicate potential for upward movement if the stock breaks above resistance levels.
Classic Pivot Points:
Resistance: ₹151.20 (R1), ₹156.15 (R2), ₹159.40 (R3)
Support: ₹139.75 (S1), ₹143.00 (S2), ₹134.80 (S3)
Pivot Point: ₹147.95
Fibonacci Levels:
Resistance: ₹151.08 (R1), ₹153.02 (R2), ₹156.15 (R3)
Support: ₹142.88 (S1), ₹144.82 (S2), ₹139.75 (S3)
Pivot Point: ₹147.95
Camarilla Levels:
Resistance: ₹147.00 (R1), ₹147.75 (R2), ₹148.50 (R3)
Support: ₹144.00 (S1), ₹144.75 (S2), ₹145.50 (S3)
Pivot Point: ₹147.95
📊 Technical Indicators
RSI (14-day): 44.06 — Neutral to slightly bearish
MACD: -0.840 — Bearish trend
Moving Averages:
20-day EMA: ₹135.67 — Neutral
50-day EMA: ₹127.34 — Neutral
100-day EMA: ₹121.00 — Uptrend
200-day EMA: ₹116.62 — Uptrend
🔍 Market Sentiment
Technical Rating: Strong Buy (based on daily analysis)
Trend Strength: ADX(14) at 26.72 — Indicates a strong trend
Stochastic RSI: 27.73 — Neutral
Ultimate Oscillator: 51.48 — Bearish
📉 Recent Performance
Recent Decline: Adani Power reported a 15.5% decline in its first-quarter profit, with consolidated net earnings dropping to ₹33.05 billion from ₹39.13 billion the previous year. The decline is attributed to subdued power demand and increased coal import costs
📌 Conclusion
Adani Power is currently in a neutral to slightly bearish phase on the daily chart, with key support around ₹139.75 and resistance near ₹151.20. The technical indicators suggest a cautious outlook, with the RSI and MACD indicating a bearish trend. However, the strong trend strength (ADX) and positive moving averages indicate potential for upward movement if the stock breaks above resistance levels.
I built a Buy & Sell Signal Indicator with 85% accuracy.
📈 Get access via DM or
WhatsApp: wa.link/d997q0
Contact - +91 76782 40962
| Email: techncialexpress@gmail.com
| Script Coder | Trader | Investor | From India
📈 Get access via DM or
WhatsApp: wa.link/d997q0
Contact - +91 76782 40962
| Email: techncialexpress@gmail.com
| Script Coder | Trader | Investor | From India
관련 발행물
면책사항
해당 정보와 게시물은 금융, 투자, 트레이딩 또는 기타 유형의 조언이나 권장 사항으로 간주되지 않으며, 트레이딩뷰에서 제공하거나 보증하는 것이 아닙니다. 자세한 내용은 이용 약관을 참조하세요.