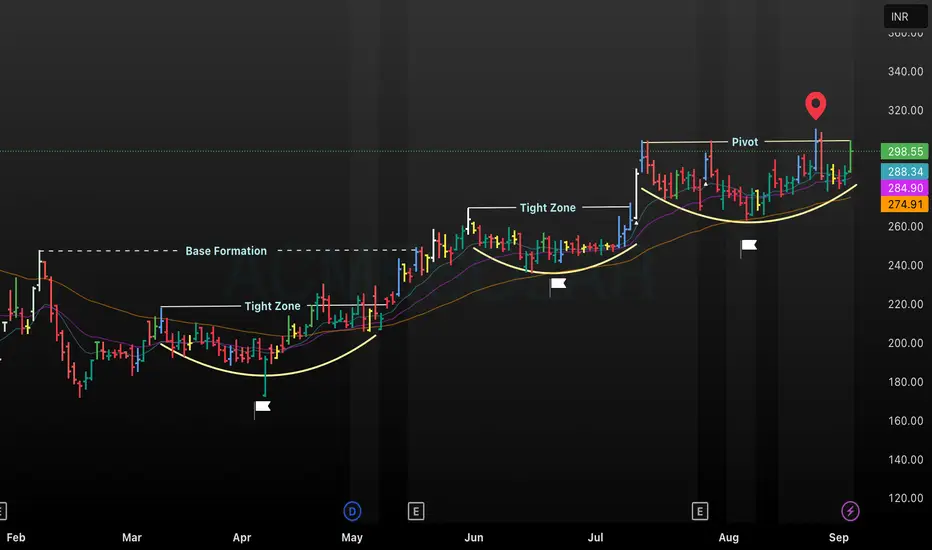
This chart of ACME shows price action over several months, highlighting key technical levels and zones. A clear base formation is established early, followed by successive tight zones indicating consolidation phases, which often precede breakouts. The pivot level mark signals a critical resistance point, with price action approaching and ultimately breaking out above it. Multiple moving averages are shown for trend context, and all major formations are annotated for quick identification, supporting both educational and trading analysis.
면책사항
해당 정보와 게시물은 금융, 투자, 트레이딩 또는 기타 유형의 조언이나 권장 사항으로 간주되지 않으며, 트레이딩뷰에서 제공하거나 보증하는 것이 아닙니다. 자세한 내용은 이용 약관을 참조하세요.
면책사항
해당 정보와 게시물은 금융, 투자, 트레이딩 또는 기타 유형의 조언이나 권장 사항으로 간주되지 않으며, 트레이딩뷰에서 제공하거나 보증하는 것이 아닙니다. 자세한 내용은 이용 약관을 참조하세요.