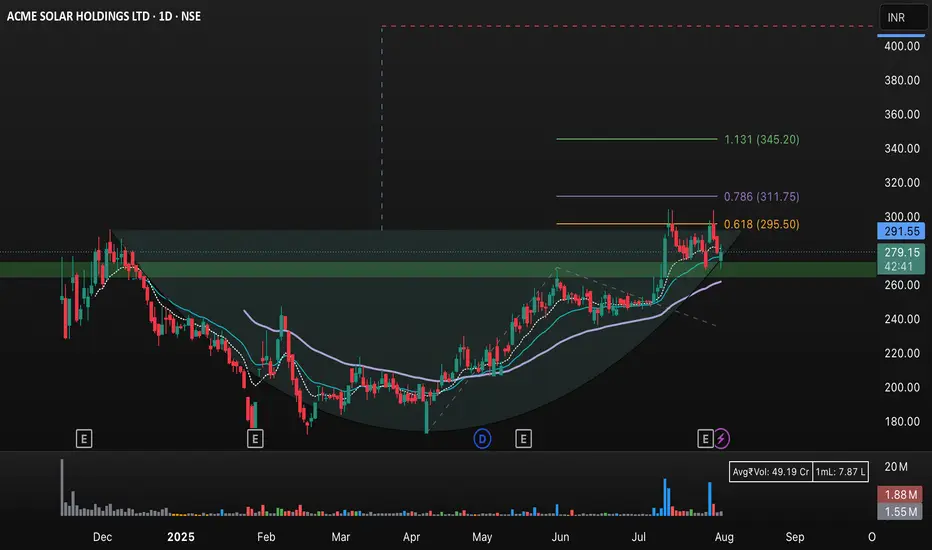
This image displays the daily candlestick chart of ACME Solar Holdings Ltd (NSE: ACMESO) on TradingView. The chart highlights key technical analysis indicators and chart patterns:
• Fibonacci retracement levels at 0.618 (₹295.50), 0.786 (₹311.75), and an extension to 1.131 (₹345.20).
• Support and resistance zones are shaded green, with significant activity around the ₹260–₹300 range.
• A potential cup-and-handle formation is visible, supporting the bullish momentum.
• The current price is ₹279.50, slightly above the 50- and 200-day moving averages (shown as blue lines).
• Volume bars at the bottom indicate substantial trading activity during recent movement.
• The chart suggests a bullish breakout if the price sustains above resistance, with targets at ₹295.50, ₹311.75, and ₹345.20 based on Fibonacci projections, while ₹260 acts as a critical support.
This setup can be used to monitor future price actions, possible breakouts, and key zones for traders and investors.
면책사항
이 정보와 게시물은 TradingView에서 제공하거나 보증하는 금융, 투자, 거래 또는 기타 유형의 조언이나 권고 사항을 의미하거나 구성하지 않습니다. 자세한 내용은 이용 약관을 참고하세요.
면책사항
이 정보와 게시물은 TradingView에서 제공하거나 보증하는 금융, 투자, 거래 또는 기타 유형의 조언이나 권고 사항을 의미하거나 구성하지 않습니다. 자세한 내용은 이용 약관을 참고하세요.