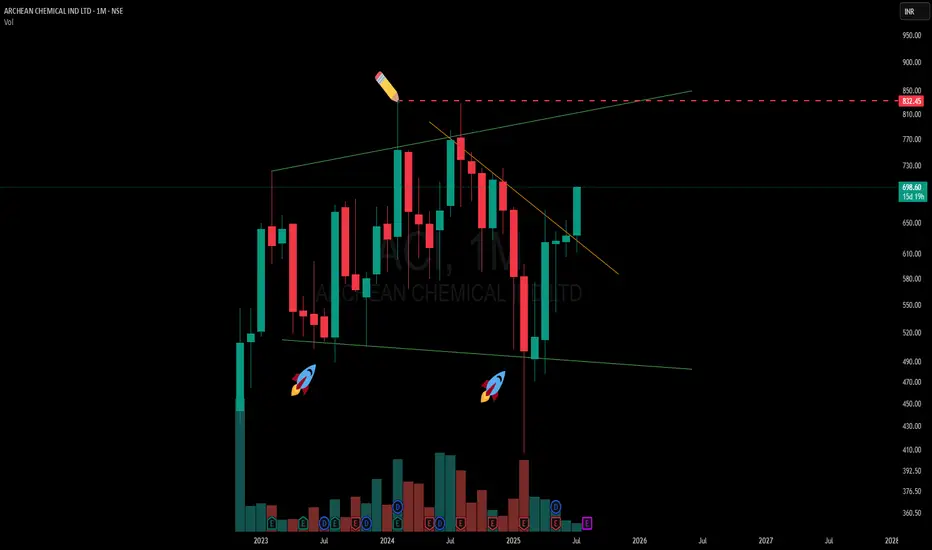
🟢A classic case of a broadening formation playing out on the higher timeframe (MTF). The green lines represent the broadening range, with price recently respecting the lower boundary — evident from the two support touches marked with 🚀 icons, each forming slightly lower lows before rebounding.
🟢 The current candle is testing a counter-trend (CT) descending trendline breakout, visible clearly after a prolonged series of lower highs. While the candle is still in progress and hasn’t closed, the structure is showing signs of compression toward the mid-zone of the broadening pattern.
📌 Upper and lower spaces remain open, highlighting the broad-range volatility typical of this setup.
No forecast — just structure. 📊
🎯 Master My Self-Made Trading Strategy
📈 Telegram (Learn Today): t.me/hashtaghammer
✅ WhatsApp (Learn Today): wa.me/919455664601
📈 Telegram (Learn Today): t.me/hashtaghammer
✅ WhatsApp (Learn Today): wa.me/919455664601
관련 발행물
면책사항
해당 정보와 게시물은 금융, 투자, 트레이딩 또는 기타 유형의 조언이나 권장 사항으로 간주되지 않으며, 트레이딩뷰에서 제공하거나 보증하는 것이 아닙니다. 자세한 내용은 이용 약관을 참조하세요.