롱
ACB Aurora Cannabis (ACB) (ACB.TO) Will it Break or Reverse?
(Due to some confusion about my previous ACB charts I have decided to make another. My previous ACB charts were reflecting past price action and time relation and how they could correlate to predict the time period in which we could see new highs.. It was not reflecting an exact target price as some have thought which I will clear up here. Sorry about the confusion, Ill be more descriptive moving forward)

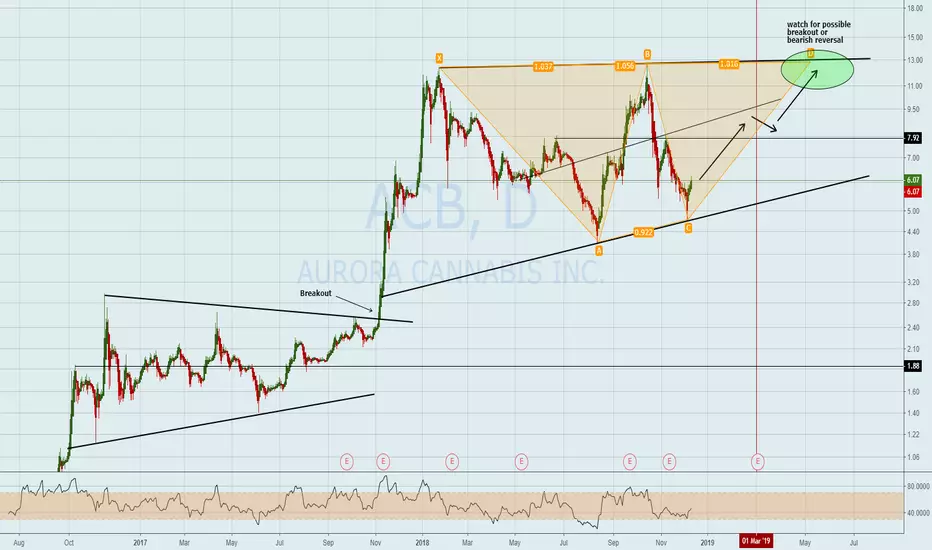
Here we see the most recent consolidated wedge where price has hit the lowest support level and pivoted upward. I think we will continue upward with strong momentum until we hit the 8/8.5 price range where we should see the bears push back. We should see a break upward through that resistance due to the greater trend upward ending at the $11 range. From here you can take profit or for the longer term investors you could hold and add more if price turns bearish. Keep in mind there will be underlying variables that could influence price action along the way. (E.g. Earnings, new acquisitions and much more)
Here we see the most recent consolidated wedge where price has hit the lowest support level and pivoted upward. I think we will continue upward with strong momentum until we hit the 8/8.5 price range where we should see the bears push back. We should see a break upward through that resistance due to the greater trend upward ending at the $11 range. From here you can take profit or for the longer term investors you could hold and add more if price turns bearish. Keep in mind there will be underlying variables that could influence price action along the way. (E.g. Earnings, new acquisitions and much more)
액티브 트레이드
This past week we saw a strong reversal to the upside. Prior to this, my original chart shows price testing support and surging to the upside without much hesitation. This shows that the demand is there and bulls are awake. After one more push from the bears ending with accumulation on the lower support, price breaks upward past the 5.35 resistance and demand takes over.면책사항
이 정보와 게시물은 TradingView에서 제공하거나 보증하는 금융, 투자, 거래 또는 기타 유형의 조언이나 권고 사항을 의미하거나 구성하지 않습니다. 자세한 내용은 이용 약관을 참고하세요.
면책사항
이 정보와 게시물은 TradingView에서 제공하거나 보증하는 금융, 투자, 거래 또는 기타 유형의 조언이나 권고 사항을 의미하거나 구성하지 않습니다. 자세한 내용은 이용 약관을 참고하세요.