This is an example although calculations should be correct, but earnings will play a huge factor on this one since earnings are tomorrow morning.
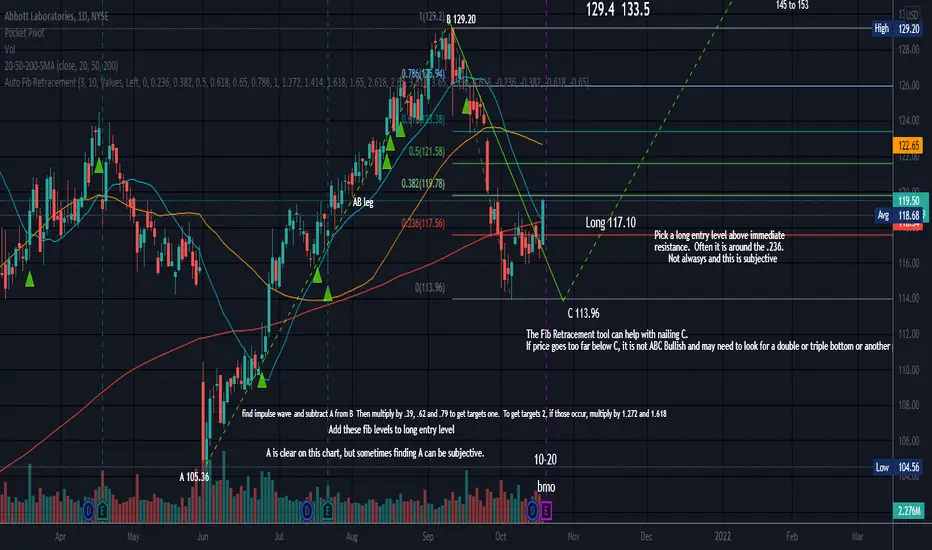
I tried to explain calculations/procedure for an ABC Bullish pattern on the chart. This particular stock has earnings in the morning so may not be a good one to risk right now, but it is ABC Bullish before earnings. Any pattern can fail.
A few folks have asked me how to calculate this pattern so I tried. If you have questions feel free to ask.
In reality, it is an ABCD pattern, with the target being D. I do not call it ABCD or AB+CD because D is not here yet when you find long entry level and nail down C. If price travels too far below C, you may be looking at a double or triple bottom, or another pattern. Price may not make it to D, rr it can go beyond D. The pattern may fail and go below C. Price may retest C more than once. It is also possible that this pattern can morph in to another pattern. Nothing is written in stone and sometimes finding A etc. can be subjective. The AB leg in an ABC Bullish pattern is an impulse wave and should be a strong move UP.
There is also a bearish ABC pattern where the impulse wave is DOWN.
C has to be above A as this is a correction pattern and not a reversal pattern. It is considered a harmonic pattern.
Hope that helps (o:
No recommendation
노트
Correction: I wrote AB+CD and it was supposed to be AB=CD면책사항
이 정보와 게시물은 TradingView에서 제공하거나 보증하는 금융, 투자, 거래 또는 기타 유형의 조언이나 권고 사항을 의미하거나 구성하지 않습니다. 자세한 내용은 이용 약관을 참고하세요.
면책사항
이 정보와 게시물은 TradingView에서 제공하거나 보증하는 금융, 투자, 거래 또는 기타 유형의 조언이나 권고 사항을 의미하거나 구성하지 않습니다. 자세한 내용은 이용 약관을 참고하세요.