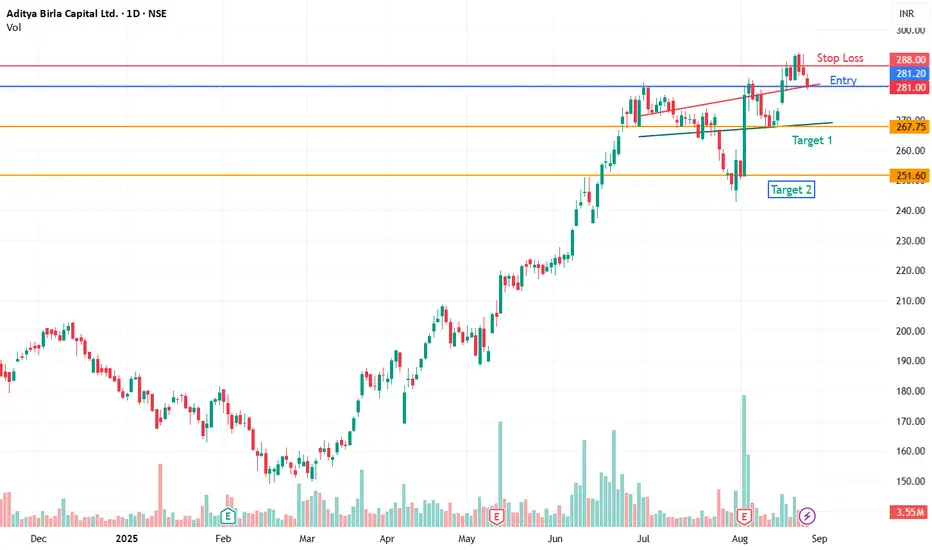
Current Price: ₹281.00
RSI (Relative Strength Index): 55.43 → Neutral to slightly bullish (above 50 but below 70).
✅ Support and Resistance
Supports:
S1: ₹268.00
S2: ₹271.35
S3: ₹271.60
Price is holding above key supports, which provides a cushion for buyers.
Resistances:
R1: ₹282.65
R2: ₹284.00
R3: ₹289.60
Stock is near immediate resistance (₹282–284 zone). Breakout above ₹289.60 could open higher levels.
✅ Fibonacci Levels
23.6%: ₹113.36
38.2%: ₹147.57
50.0%: ₹175.22
61.8%: ₹202.88
78.6%: ₹242.25
Current price (₹281) is well above the 78.6% retracement, indicating strong recovery and continuation of the uptrend.
✅ Moving Averages
Short-Term:
EMA5 = ₹283.68, SMA5 = ₹285.46 → Price slightly below → mild short-term weakness.
EMA9 = ₹281.96, SMA9 = ₹282.28 → Price hovering around → neutral.
Medium-Term:
EMA20 = ₹276.99, SMA20 = ₹273.83 → Price above → bullish medium-term bias.
Long-Term:
EMA50 = ₹265.27, SMA50 = ₹270.89 → Price above both → strength in broader trend.
EMA100 = ₹246.26, SMA100 = ₹240.71 → Price above → long-term bullish trend.
EMA200 = ₹226.74, SMA200 = ₹209.18 → Price well above → strong bullish structure.
면책사항
해당 정보와 게시물은 금융, 투자, 트레이딩 또는 기타 유형의 조언이나 권장 사항으로 간주되지 않으며, 트레이딩뷰에서 제공하거나 보증하는 것이 아닙니다. 자세한 내용은 이용 약관을 참조하세요.
면책사항
해당 정보와 게시물은 금융, 투자, 트레이딩 또는 기타 유형의 조언이나 권장 사항으로 간주되지 않으며, 트레이딩뷰에서 제공하거나 보증하는 것이 아닙니다. 자세한 내용은 이용 약관을 참조하세요.