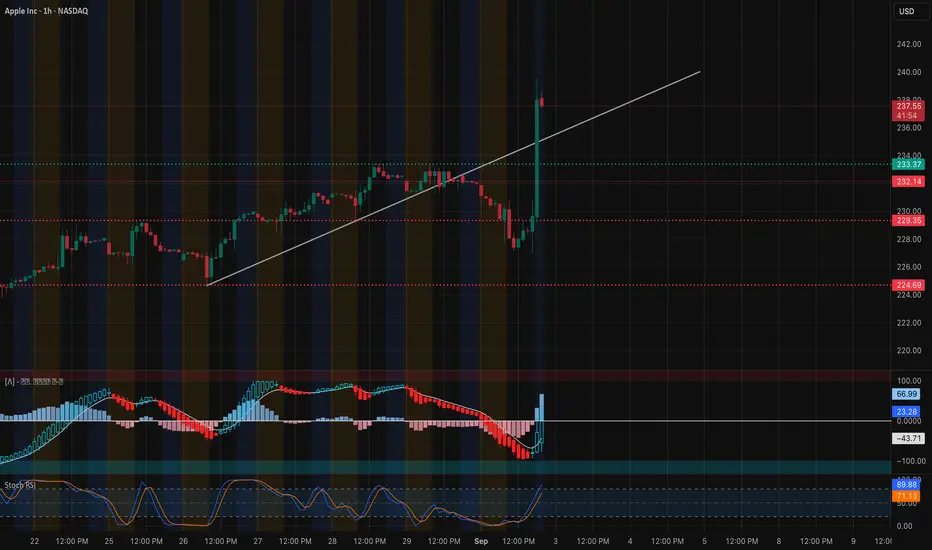
Apple exploded higher off the 227.5 – 228 support zone, staging a sharp rally that broke through short-term resistance and reclaimed momentum. The move was confirmed by a strong MACD bullish cross with expanding histogram, and Stoch RSI pushing deep into overbought, signaling strong momentum but also potential near-term exhaustion.
Price is now pressing into 237–238, a heavy resistance cluster from both prior supply and options positioning. This zone represents the immediate test for bulls. A clean breakout would open the path toward 240, and potentially 242.5, where the next resistance bands align.
On the downside, 232.5 – 233 is now first support. Below that, 230 and then 227.5 serve as key demand levels. Losing those would negate today’s breakout momentum and shift control back to sellers.
🔍 Options / GEX Confirmation

* Resistance:
* 237 (20% GEX concentration) → current rejection zone.
* 240 – 242.5 → stacked resistance confirmed by call positioning.
* Support:
* 233 – 232.5 (3rd call wall / structural support) → bulls must defend this to keep momentum.
* 230 → strong pivot zone.
* 227.5 → deep support and base of the breakout.
Options flow confirms exactly what the chart is showing: 237 is a key battleground, while 240–242.5 remains the ceiling until bulls prove control.
🎯 Trade Scenarios
* Bullish: Hold above 233 and break through 237 with volume → targets 240, then 242.5.
* Bearish: Failure at 237 and a drop back under 233 → downside targets 230 → 227.5.
Apple’s rebound was explosive, but the 237–238 zone is the real test. If buyers can push through, upside momentum extends toward 240–242.5. If not, watch for a pullback to 233 or even 230 before attempting higher.
Price is now pressing into 237–238, a heavy resistance cluster from both prior supply and options positioning. This zone represents the immediate test for bulls. A clean breakout would open the path toward 240, and potentially 242.5, where the next resistance bands align.
On the downside, 232.5 – 233 is now first support. Below that, 230 and then 227.5 serve as key demand levels. Losing those would negate today’s breakout momentum and shift control back to sellers.
🔍 Options / GEX Confirmation
* Resistance:
* 237 (20% GEX concentration) → current rejection zone.
* 240 – 242.5 → stacked resistance confirmed by call positioning.
* Support:
* 233 – 232.5 (3rd call wall / structural support) → bulls must defend this to keep momentum.
* 230 → strong pivot zone.
* 227.5 → deep support and base of the breakout.
Options flow confirms exactly what the chart is showing: 237 is a key battleground, while 240–242.5 remains the ceiling until bulls prove control.
🎯 Trade Scenarios
* Bullish: Hold above 233 and break through 237 with volume → targets 240, then 242.5.
* Bearish: Failure at 237 and a drop back under 233 → downside targets 230 → 227.5.
Apple’s rebound was explosive, but the 237–238 zone is the real test. If buyers can push through, upside momentum extends toward 240–242.5. If not, watch for a pullback to 233 or even 230 before attempting higher.
면책사항
이 정보와 게시물은 TradingView에서 제공하거나 보증하는 금융, 투자, 거래 또는 기타 유형의 조언이나 권고 사항을 의미하거나 구성하지 않습니다. 자세한 내용은 이용 약관을 참고하세요.
면책사항
이 정보와 게시물은 TradingView에서 제공하거나 보증하는 금융, 투자, 거래 또는 기타 유형의 조언이나 권고 사항을 의미하거나 구성하지 않습니다. 자세한 내용은 이용 약관을 참고하세요.