AAPL has already been affected by a Bearish Head & Shoulders reversal pattern earlier this year (see related).
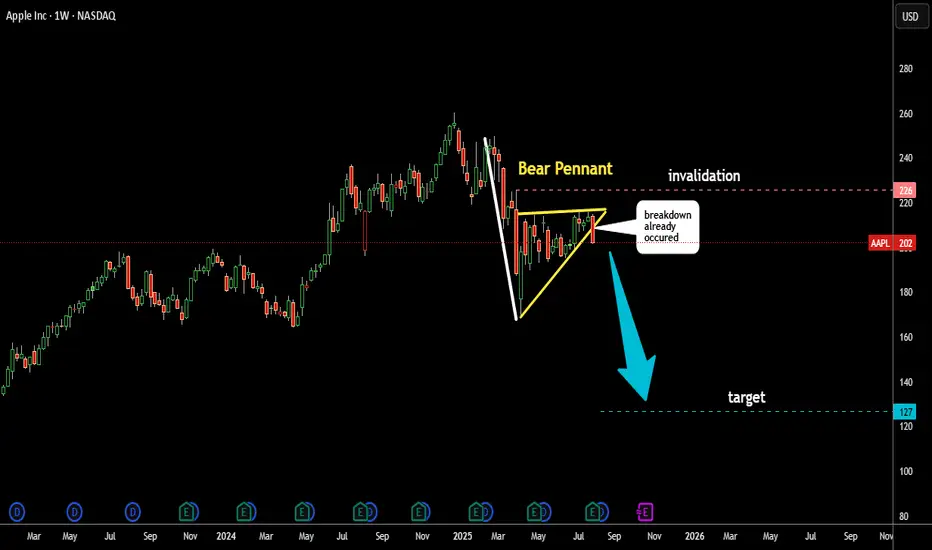
Now, another bearish pattern has formed — a Pennant (highlighted in yellow).
The price has broken below the Pennant’s support, triggering a potential bearish move.
The target is calculated by subtracting the length of the Pole (in white) from the support level of the pattern.
This target is marked with a blue dashed line at $127.
Is Apple melting down again?
I’d love to read your thoughts.
관련 발행물
면책사항
해당 정보와 게시물은 금융, 투자, 트레이딩 또는 기타 유형의 조언이나 권장 사항으로 간주되지 않으며, 트레이딩뷰에서 제공하거나 보증하는 것이 아닙니다. 자세한 내용은 이용 약관을 참조하세요.
면책사항
해당 정보와 게시물은 금융, 투자, 트레이딩 또는 기타 유형의 조언이나 권장 사항으로 간주되지 않으며, 트레이딩뷰에서 제공하거나 보증하는 것이 아닙니다. 자세한 내용은 이용 약관을 참조하세요.