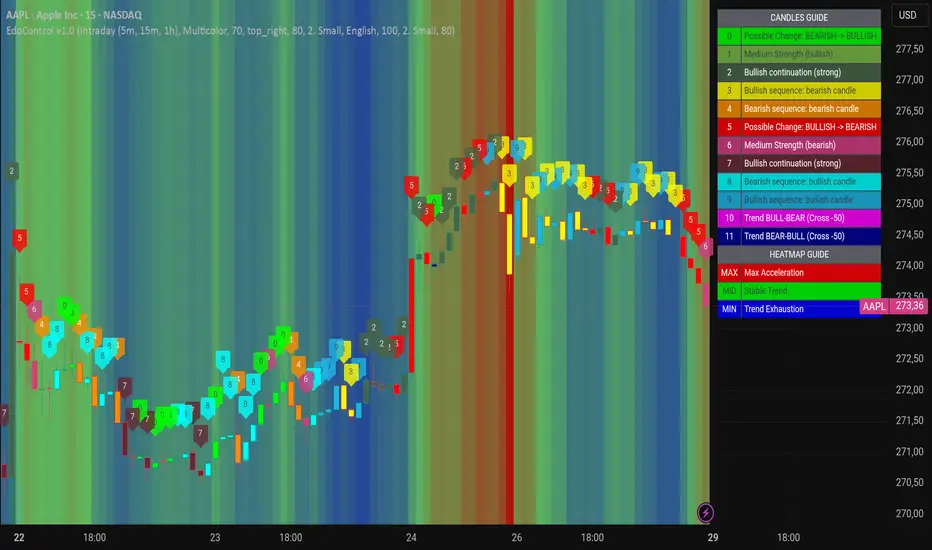
This AAPL 15-minute chart illustrates how intraday price action evolves through internal phases rather than reversing abruptly.
During the earlier part of the move, price develops within a relatively stable bullish environment. Continuation phases are respected, momentum remains coherent, and the broader context supports higher prices. As the session progresses, that internal structure begins to deteriorate: bullish sequences lose consistency, momentum becomes fragmented, and continuation attempts fail to extend meaningfully.
Edo Control is designed to make this internal market behavior visible. Through color-coded candles and a contextual heatmap, the indicator helps identify when price is trending with strength, when momentum starts to decay, and when the market transitions into a different regime.
Before the downside acceleration becomes obvious on price alone, the background context shifts from stability into exhaustion and, eventually, bearish acceleration. The move itself is not sudden; it is preceded by a gradual degradation of internal conditions that can be observed when focusing on structure rather than isolated candles.
This type of analysis is especially relevant for intraday traders who prioritize context over prediction. The goal is not to call precise tops or bottoms, but to recognize when the market environment no longer supports continuation and risk increases.
This idea does not present trade entries or performance results. It focuses on market reading and contextual awareness. The current version of the indicator emphasizes visual clarity and structural interpretation. More advanced confirmation logic and execution-oriented features are being developed on top of this foundation.
Edolab Markets — Precision trading tools
면책사항
해당 정보와 게시물은 금융, 투자, 트레이딩 또는 기타 유형의 조언이나 권장 사항으로 간주되지 않으며, 트레이딩뷰에서 제공하거나 보증하는 것이 아닙니다. 자세한 내용은 이용 약관을 참조하세요.
Edolab Markets — Precision trading tools
면책사항
해당 정보와 게시물은 금융, 투자, 트레이딩 또는 기타 유형의 조언이나 권장 사항으로 간주되지 않으며, 트레이딩뷰에서 제공하거나 보증하는 것이 아닙니다. 자세한 내용은 이용 약관을 참조하세요.