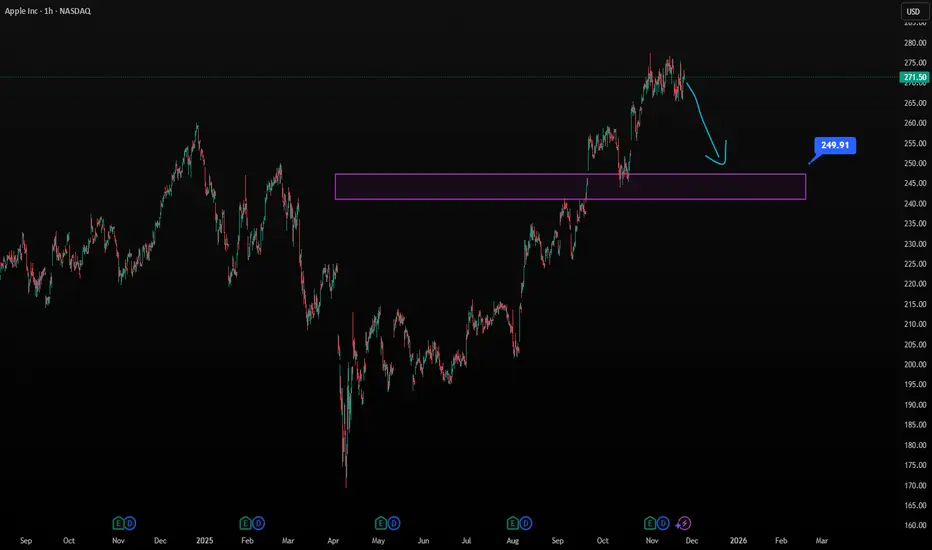
AAPL 's H1 chart suggests a midterm pullback from $271 toward $250 as trend strength softens. Technically, momentum indicators show divergence after a steady climb. Fundamentally, stable services revenue supports the stock, but softer global device demand may limit upside near term. A correction to $250 would align price with fair-value zones.