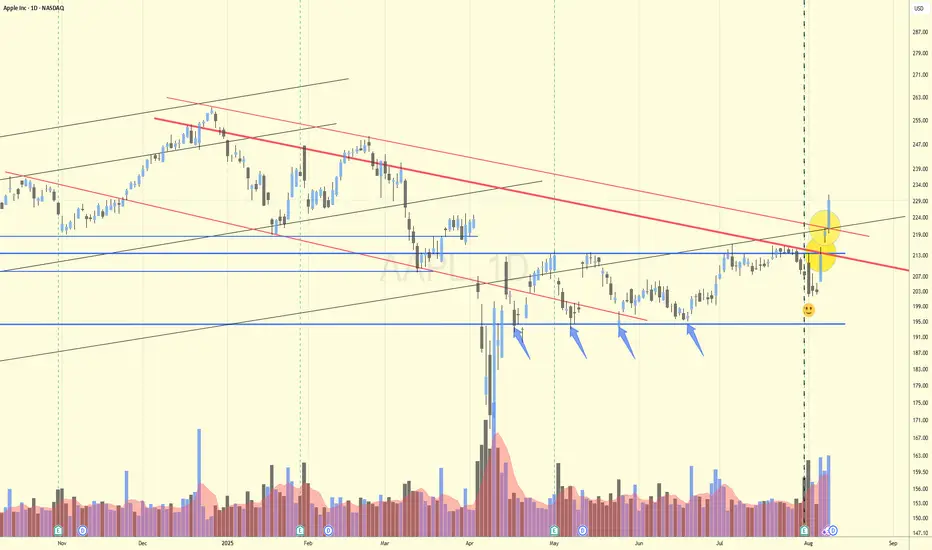
SOME INTERESTING CHART FEATURES
1. This often works...notice four price touches onto the the blue horizontal support line at $194 and then when it doesn't touch (see smiley) it often triggers a move, as in this case!
2. There's above average volume, verifying the move.
3. In recent years it's noticeable that multiple parallel trendlines coexist due to the trading computer algorithms. In this case there's a CLEAR parallel 'internal' trendline which was broken 1 day earlier than the higher trendline which was broken out off today.
To discover the 'internal' trendline resistances and supports, be prepared to draw through 'aberrations' of price movement. In this case there was a confluence between the downward-sloping black trendline, the closing price and the long-term rising black support.
4. The thick blue horizontal level at $214 produces a confluence in conjunction with the closing price line and the thick red downward-sloping resistance.
5. Another thing you often see, as with AAPL is the price initially going DOWN after decent results (Puzzled me for nearly 30yrs!) and then shooting upwards.
PS: Yellow circles denote centres of confluence.
1. This often works...notice four price touches onto the the blue horizontal support line at $194 and then when it doesn't touch (see smiley) it often triggers a move, as in this case!
2. There's above average volume, verifying the move.
3. In recent years it's noticeable that multiple parallel trendlines coexist due to the trading computer algorithms. In this case there's a CLEAR parallel 'internal' trendline which was broken 1 day earlier than the higher trendline which was broken out off today.
To discover the 'internal' trendline resistances and supports, be prepared to draw through 'aberrations' of price movement. In this case there was a confluence between the downward-sloping black trendline, the closing price and the long-term rising black support.
4. The thick blue horizontal level at $214 produces a confluence in conjunction with the closing price line and the thick red downward-sloping resistance.
5. Another thing you often see, as with
PS: Yellow circles denote centres of confluence.
면책사항
이 정보와 게시물은 TradingView에서 제공하거나 보증하는 금융, 투자, 거래 또는 기타 유형의 조언이나 권고 사항을 의미하거나 구성하지 않습니다. 자세한 내용은 이용 약관을 참고하세요.
면책사항
이 정보와 게시물은 TradingView에서 제공하거나 보증하는 금융, 투자, 거래 또는 기타 유형의 조언이나 권고 사항을 의미하거나 구성하지 않습니다. 자세한 내용은 이용 약관을 참고하세요.