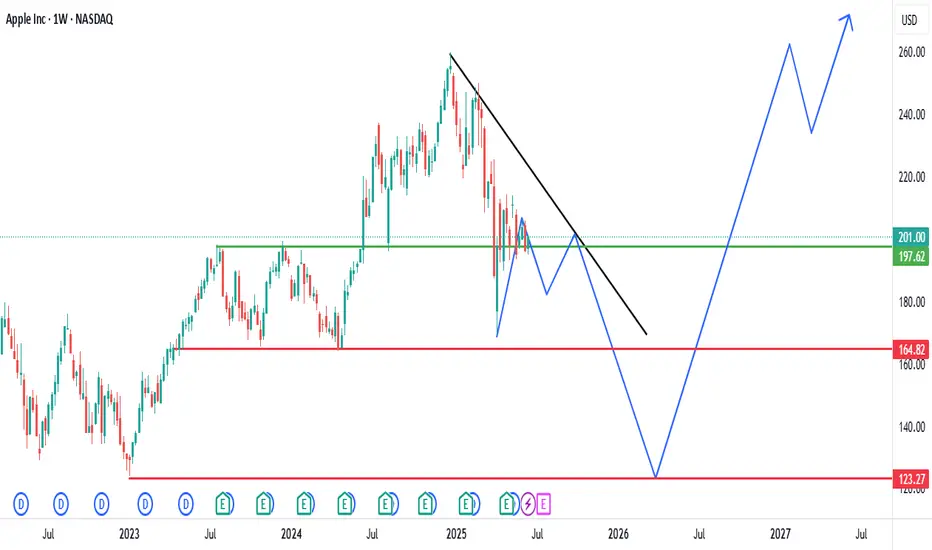
Historical Trend: The chart shows Apple Inc.'s stock price on a weekly timeframe from 2022 to mid-2025. The stock exhibited a strong upward trend from 2022 to early 2025, with notable growth followed by periods of consolidation and correction.
Key Levels:
Resistance: The $201.00-$197.62 range (green line) has acted as a significant resistance level. The price recently broke above this zone, suggesting potential bullish momentum.
Support: The $164.82 level (red line) has served as a major support zone. The stock tested this level during a recent decline and rebounded, indicating its strength.
Recent Price Action: After reaching a peak near $201.00, the stock entered a descending triangle pattern (black trendline). A breakout above the resistance at $201.00 is evident, accompanied by an upward projection (blue arrow), hinting at a possible continuation of the bullish trend.
Projected Movement: The upward projection suggests the stock could target levels around $240.00-$260.00 if the breakout holds. However, a failure to maintain above $201.00 might lead to a retest of the $164.82 support.
Volume and Indicators: The chart includes Bollinger Bands (O197.30 H201.70 L195.07 C201.00) with a -4.55 (-2.22%) change, indicating recent volatility. Specific volume data is not detailed, but the breakout suggests increasing buying pressure.
Outlook: The stock is currently in a bullish phase following the breakout above $201.00.
Maintaining above this level could drive further gains, while a drop below might signal a return to the $164.82 support. Close monitoring of price action around these levels is recommended.
면책사항
해당 정보와 게시물은 금융, 투자, 트레이딩 또는 기타 유형의 조언이나 권장 사항으로 간주되지 않으며, 트레이딩뷰에서 제공하거나 보증하는 것이 아닙니다. 자세한 내용은 이용 약관을 참조하세요.
면책사항
해당 정보와 게시물은 금융, 투자, 트레이딩 또는 기타 유형의 조언이나 권장 사항으로 간주되지 않으며, 트레이딩뷰에서 제공하거나 보증하는 것이 아닙니다. 자세한 내용은 이용 약관을 참조하세요.