If we look at AAPL a different way, again - looking at only the technicals - we see the 4 rules of Ichimoku are telling us that this stock is currently: Bullish.
That being said, there are some red flags popping up that I have also labeled. We could nit pick a couple more, but I ran out of room and wanted to keep this as simple as possible.
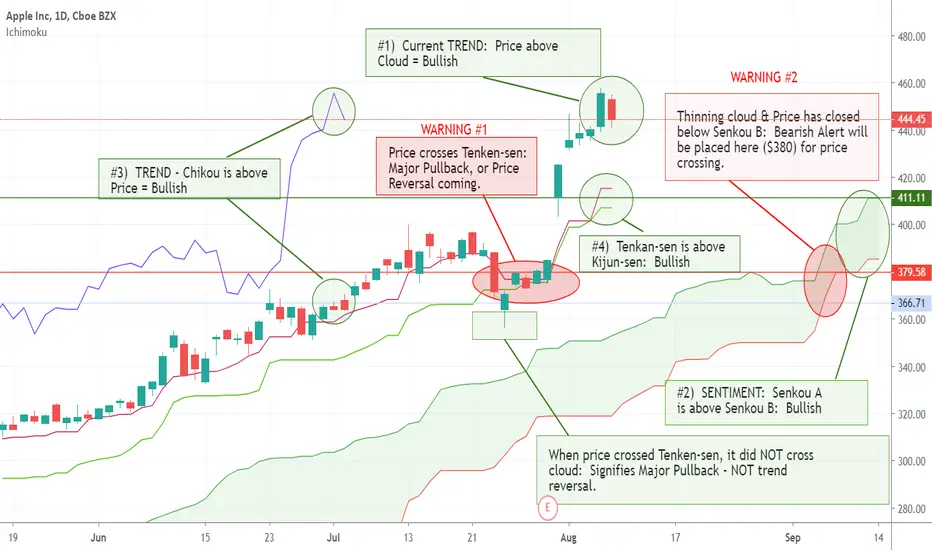
4 Rules:
1) Price in relation to Cloud: Price is Above Cloud = Bullish
2) Tenkan-sen in relation to Kijun-sen: Tenkan-sen above Kijun-sen = Bullish
3) Relationship of Chikou to Price: Chikou is Well Above Price = Bullish
4) Senkou A in relation to Senkou B: Senkou A is over Senkou B = Bullish
Warnings:
1) Price has crossed paths with Tenkan-sen - Signifying either a Major Pullback, or a Trend Reversal: The price has crossed over the Tenkan-sen line - this is a major red flag! We look closer, and find the price never surpassed down to, or through the Cloud. So this means this is a Major Pullback, but not a Trend Reversal.
Looking to the futhure, we see the price that has crossed this line, has also crossed below Senkou B - Signifying an entry point we want to stay AWAY from. So we draw a line at this spot, count the number of bars that consolidated at this point, and we will set an alert here.
2) The Cloud itself is thinning. A thinning cloud leads to a higher probability of a Trend Reversal. As we just had price hitting Tenkan-sen, we will start watching Candlestick patterns for signs of Reversals.
In one of my other posts, we already identified the 2 Candlestick pattern from Today and Yesterday, as a Bearish Harami. This is significant, and normally a sign of a reversal. We must look for 1 more Candlestick to confirm!
Thanks!
That being said, there are some red flags popping up that I have also labeled. We could nit pick a couple more, but I ran out of room and wanted to keep this as simple as possible.
4 Rules:
1) Price in relation to Cloud: Price is Above Cloud = Bullish
2) Tenkan-sen in relation to Kijun-sen: Tenkan-sen above Kijun-sen = Bullish
3) Relationship of Chikou to Price: Chikou is Well Above Price = Bullish
4) Senkou A in relation to Senkou B: Senkou A is over Senkou B = Bullish
Warnings:
1) Price has crossed paths with Tenkan-sen - Signifying either a Major Pullback, or a Trend Reversal: The price has crossed over the Tenkan-sen line - this is a major red flag! We look closer, and find the price never surpassed down to, or through the Cloud. So this means this is a Major Pullback, but not a Trend Reversal.
Looking to the futhure, we see the price that has crossed this line, has also crossed below Senkou B - Signifying an entry point we want to stay AWAY from. So we draw a line at this spot, count the number of bars that consolidated at this point, and we will set an alert here.
2) The Cloud itself is thinning. A thinning cloud leads to a higher probability of a Trend Reversal. As we just had price hitting Tenkan-sen, we will start watching Candlestick patterns for signs of Reversals.
In one of my other posts, we already identified the 2 Candlestick pattern from Today and Yesterday, as a Bearish Harami. This is significant, and normally a sign of a reversal. We must look for 1 more Candlestick to confirm!
Thanks!
면책사항
해당 정보와 게시물은 금융, 투자, 트레이딩 또는 기타 유형의 조언이나 권장 사항으로 간주되지 않으며, 트레이딩뷰에서 제공하거나 보증하는 것이 아닙니다. 자세한 내용은 이용 약관을 참조하세요.
면책사항
해당 정보와 게시물은 금융, 투자, 트레이딩 또는 기타 유형의 조언이나 권장 사항으로 간주되지 않으며, 트레이딩뷰에서 제공하거나 보증하는 것이 아닙니다. 자세한 내용은 이용 약관을 참조하세요.