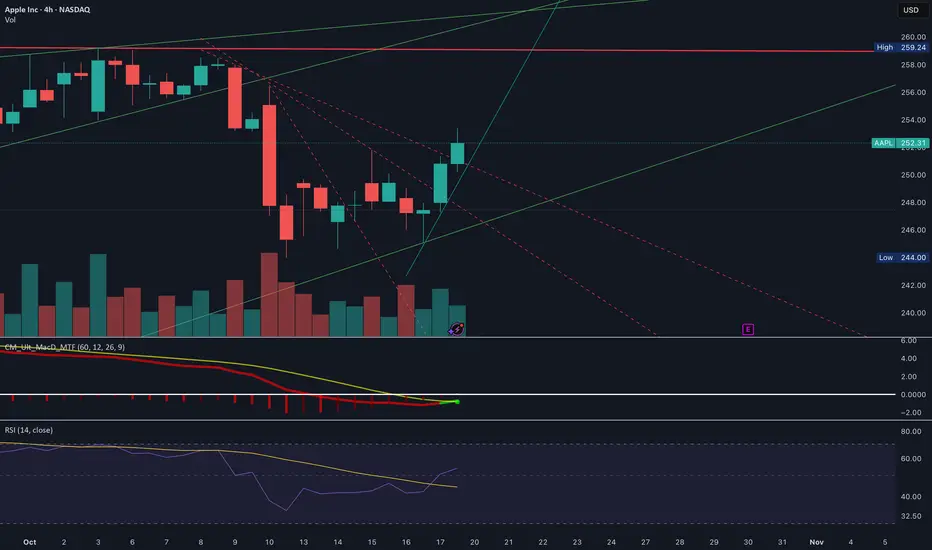
On the 4-hour chart, Apple began a noticeable downward trend around October 8. That trend appears to have shifted around October 16, when the stock hit a low of $245. Since then, it has rebounded to approximately $252.
The strength of this bounce suggests the possibility of continued upward momentum in the short term, potentially lasting through the week leading up to earnings on October 30. Traders may want to watch for support near $245–$248 and resistance near $255–$257, which could indicate the next potential price moves.
The strength of this bounce suggests the possibility of continued upward momentum in the short term, potentially lasting through the week leading up to earnings on October 30. Traders may want to watch for support near $245–$248 and resistance near $255–$257, which could indicate the next potential price moves.
면책사항
해당 정보와 게시물은 금융, 투자, 트레이딩 또는 기타 유형의 조언이나 권장 사항으로 간주되지 않으며, 트레이딩뷰에서 제공하거나 보증하는 것이 아닙니다. 자세한 내용은 이용 약관을 참조하세요.
면책사항
해당 정보와 게시물은 금융, 투자, 트레이딩 또는 기타 유형의 조언이나 권장 사항으로 간주되지 않으며, 트레이딩뷰에서 제공하거나 보증하는 것이 아닙니다. 자세한 내용은 이용 약관을 참조하세요.