📌 AAPL Analysis – 4H Timeframe
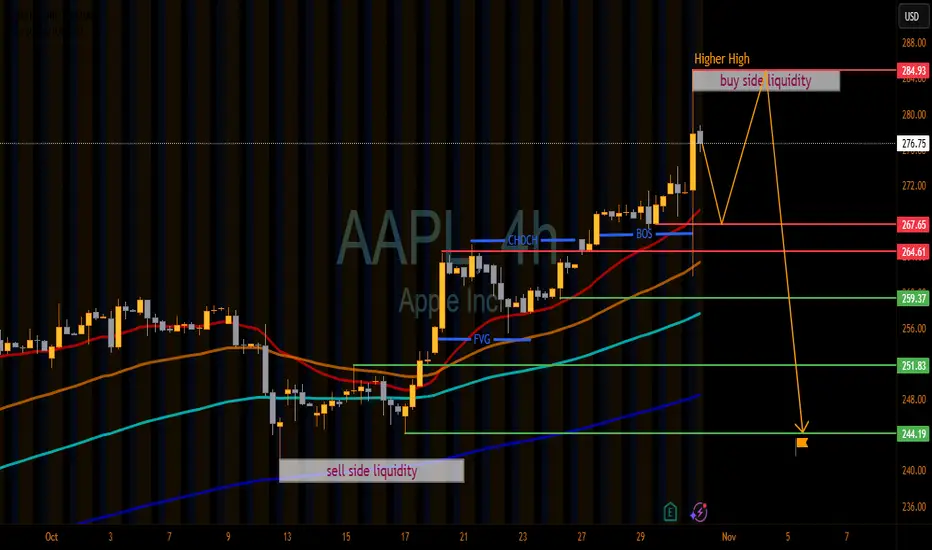
By analyzing the AAPL chart on the 4-hour timeframe, we can see that after taking Buy-Side Liquidity near 284.93 and forming a Higher High, price is showing signs of a potential reaction from this zone.
If Apple fails to break and sustain above this level, we may see a short-term pullback toward the support area at 267.65 – 264.61.
A strong break below this zone could open the way for a deeper decline toward 259.37 and even 251.83.
The major downside liquidity target remains around 244.19, where we expect buyers to step back in.
This analysis will be updated soon!
Please support me with your likes and comments to motivate me to share more analysis with you and share your opinion about the possible trend of this chart with me!
Best Regards,
HoneySpotTrading
액티브 트레이드
Join My Telegram Channel Link 👇
t.me/honeymarketinsighter
Join My Refferel Broker Link 👇
one.exnessonelink.com/a/uvd1etcgg1
Refferel code 👇
uvd1etcgg1
t.me/honeymarketinsighter
Join My Refferel Broker Link 👇
one.exnessonelink.com/a/uvd1etcgg1
Refferel code 👇
uvd1etcgg1
관련 발행물
면책사항
이 정보와 게시물은 TradingView에서 제공하거나 보증하는 금융, 투자, 거래 또는 기타 유형의 조언이나 권고 사항을 의미하거나 구성하지 않습니다. 자세한 내용은 이용 약관을 참고하세요.