AAPL Elliott Wave Update: Wave 4 Triangle Nears Completion – $300+ Wave 5 Targets Ahead
AAPL continues its bullish trajectory in a classic 5-wave impulse structure, originating from the April 2025 low of $169.21 following an ABC correction from late 2024 highs. This rally has delivered over 70% gains, confirming a higher-degree Wave ((5)) within the multi-year uptrend.
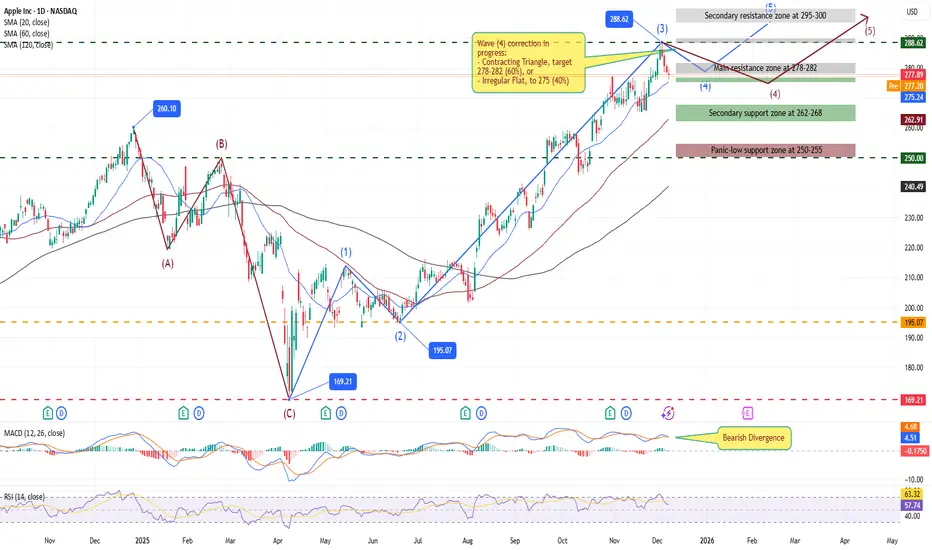
The impulse kicked off with Wave 1 surging to $213 (May high), followed by a shallow Wave 2 retracement to $195.07 (0.618 Fib), respecting the origin without overlap. Wave 3 then extended aggressively to $288.62 (December 3 high), measuring 1.618x Wave 1 and driving the strongest momentum since the blue-box low. Volume spiked during this extension, underscoring institutional buying.
We're now in Wave 4, a textbook sideways correction trading in the $276-282 range. Recent action suggests a Contracting Triangle (a-b-c-d-e pattern), with converging trendlines targeting a resolution near $277-282. Alternatively, an Irregular Flat could form if we probe $275 (0.382 Fib of Wave 3).
Bearish divergence on RSI (57.74) and MACD hints at waning momentum, but the 50-day SMA at $275.24 provides firm support. Critically, no overlap with Wave 1 high ($213) – a key invalidation level – keeps the structure intact.
Wave 5 targets align with Fib extensions: initial $290-293 (0.618 of Waves 1-3), standard $300-310 (1.0-1.618x). The parallel channel upper rail supports $305, fueled by AI tailwinds and upcoming Q1 earnings. Risk: Break below $270 channels a deeper pullback to $262, but VIX under 14 favors bulls.
Multi-month hold for longs above $275; add on triangle breakout with stops at $274. Structure remains bullish – Wave 5 could cap the year strong. What's your take?
Disclaimer: This analysis is for educational purposes only and is not investment advice. Please do your own research (DYOR) before making any trading decisions.
AAPL continues its bullish trajectory in a classic 5-wave impulse structure, originating from the April 2025 low of $169.21 following an ABC correction from late 2024 highs. This rally has delivered over 70% gains, confirming a higher-degree Wave ((5)) within the multi-year uptrend.
The impulse kicked off with Wave 1 surging to $213 (May high), followed by a shallow Wave 2 retracement to $195.07 (0.618 Fib), respecting the origin without overlap. Wave 3 then extended aggressively to $288.62 (December 3 high), measuring 1.618x Wave 1 and driving the strongest momentum since the blue-box low. Volume spiked during this extension, underscoring institutional buying.
We're now in Wave 4, a textbook sideways correction trading in the $276-282 range. Recent action suggests a Contracting Triangle (a-b-c-d-e pattern), with converging trendlines targeting a resolution near $277-282. Alternatively, an Irregular Flat could form if we probe $275 (0.382 Fib of Wave 3).
Bearish divergence on RSI (57.74) and MACD hints at waning momentum, but the 50-day SMA at $275.24 provides firm support. Critically, no overlap with Wave 1 high ($213) – a key invalidation level – keeps the structure intact.
Wave 5 targets align with Fib extensions: initial $290-293 (0.618 of Waves 1-3), standard $300-310 (1.0-1.618x). The parallel channel upper rail supports $305, fueled by AI tailwinds and upcoming Q1 earnings. Risk: Break below $270 channels a deeper pullback to $262, but VIX under 14 favors bulls.
Multi-month hold for longs above $275; add on triangle breakout with stops at $274. Structure remains bullish – Wave 5 could cap the year strong. What's your take?
Disclaimer: This analysis is for educational purposes only and is not investment advice. Please do your own research (DYOR) before making any trading decisions.
“Discussion is welcome. Respect all views — markets are dynamic.”
면책사항
해당 정보와 게시물은 금융, 투자, 트레이딩 또는 기타 유형의 조언이나 권장 사항으로 간주되지 않으며, 트레이딩뷰에서 제공하거나 보증하는 것이 아닙니다. 자세한 내용은 이용 약관을 참조하세요.
“Discussion is welcome. Respect all views — markets are dynamic.”
면책사항
해당 정보와 게시물은 금융, 투자, 트레이딩 또는 기타 유형의 조언이나 권장 사항으로 간주되지 않으며, 트레이딩뷰에서 제공하거나 보증하는 것이 아닙니다. 자세한 내용은 이용 약관을 참조하세요.