📈  AAPL Weekly Chart Update
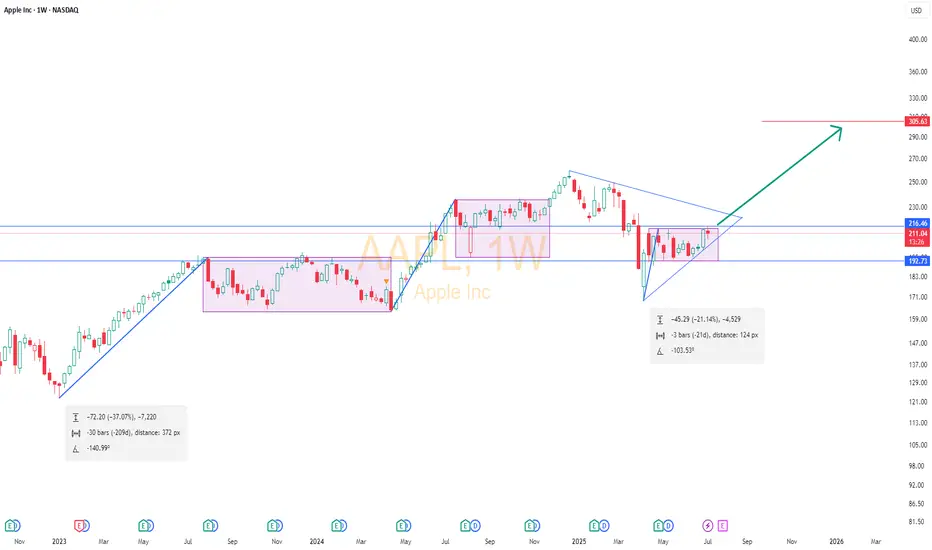
Apple is forming its third bullish flag since Jan 2023.
🔹 Flags:
1️⃣ Jan 2023 – Feb 2024
2️⃣ May 2024 – Mar 2025
3️⃣ Ongoing since Apr 2025
🔺 A triangle formation from Dec 2024 to Apr 2025 low is also converging.
💥 Breakout level: Weekly close above $216
📉 Stop Loss: $193 (weekly close)
🎯 Target: $305 in coming weeks
Technicals point to a strong bullish setup. Keep it on watch!
#AAPL #Apple #StockMarket #ChartAnalysis #TradingView
면책사항
해당 정보와 게시물은 금융, 투자, 트레이딩 또는 기타 유형의 조언이나 권장 사항으로 간주되지 않으며, 트레이딩뷰에서 제공하거나 보증하는 것이 아닙니다. 자세한 내용은 이용 약관을 참조하세요.
면책사항
해당 정보와 게시물은 금융, 투자, 트레이딩 또는 기타 유형의 조언이나 권장 사항으로 간주되지 않으며, 트레이딩뷰에서 제공하거나 보증하는 것이 아닙니다. 자세한 내용은 이용 약관을 참조하세요.