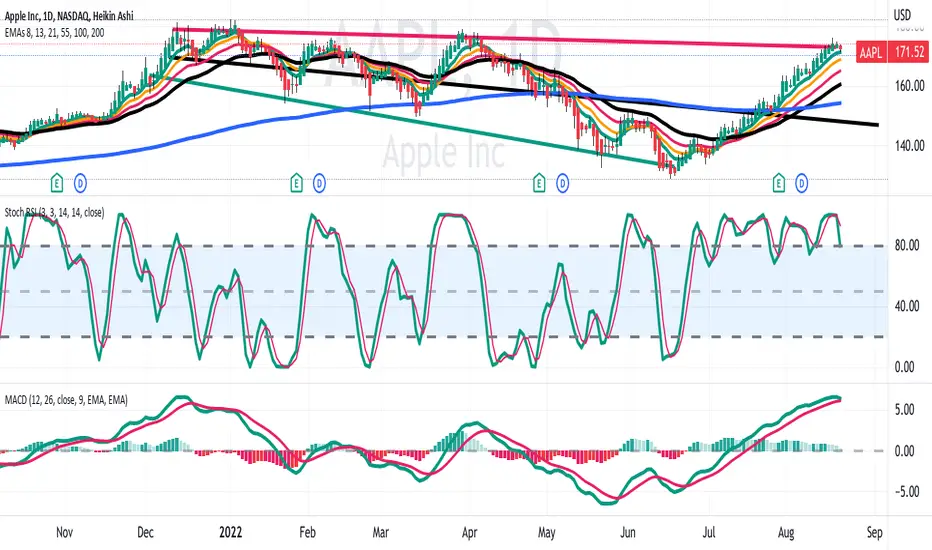
Apple has been in a megaphone pattern for the last month.
It is now at a horizontal and trendline resistance similar to
conditions on December 13, 2021.
Relative Strength has been high over 80 for much of the month.
The MACD signal is high over its histogram, and the K and D
lines appear primed for a crossover. Both of these indicators
conditions existed back on December 13, 2021.
I see this analysis as a suitable foundation for an excellent
swing long trade in stock or put options expecting AAPL
to fall from the resistance trendline back towards the
mean line of the megaphone pattern. In doing so,
I set the stop loss at $5.00 above the market price, while
targetting the EMA200 or the center line of the megaphone
the pattern shown on the chart in black.
( As an aside the AAPL inverse bear fund is AAPD available
at a lower price than AAPL In reviewing the AAPD chart
I see a reversal from downtrend to an uptrend in the
past two trading days with some bullish engulfing candles.)
면책사항
이 정보와 게시물은 TradingView에서 제공하거나 보증하는 금융, 투자, 거래 또는 기타 유형의 조언이나 권고 사항을 의미하거나 구성하지 않습니다. 자세한 내용은 이용 약관을 참고하세요.
면책사항
이 정보와 게시물은 TradingView에서 제공하거나 보증하는 금융, 투자, 거래 또는 기타 유형의 조언이나 권고 사항을 의미하거나 구성하지 않습니다. 자세한 내용은 이용 약관을 참고하세요.