Arriyadh Development Company (4150) - Technical Analysis
Pattern: Bullish Dragon Pattern
Context:
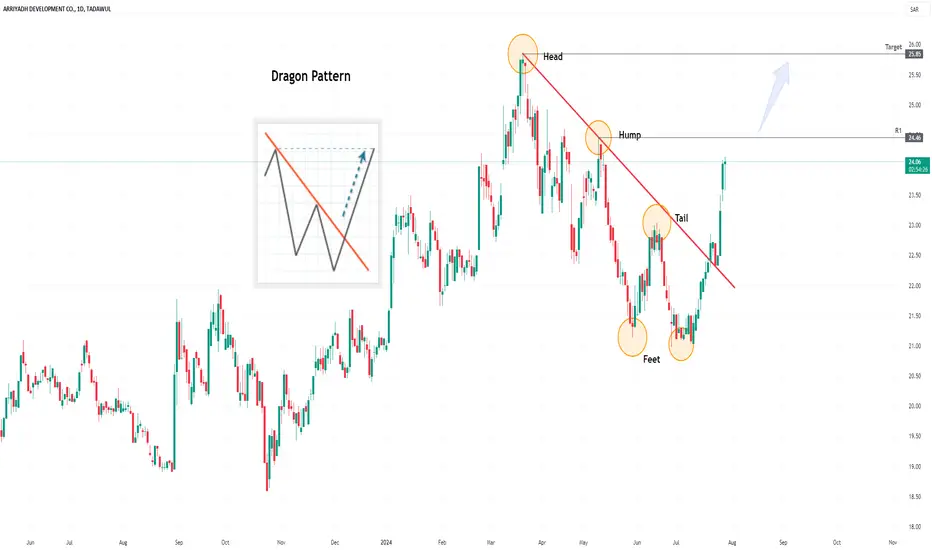
Previous Trend: The stock price was in a downtrend since reaching a peak of SAR 25.85. During this downtrend, the price made lower lows and lower highs, resting around SAR 21.
Breakout: A breakout was observed from the descending trend line.
Pattern Details:
First Candle: Long bearish candle during the downtrend.
Second Candle: Small-bodied candle that gapped down.
Third Candle: Long bullish candle that closed above the trend line at approximately SAR 22.70.
Support: After the breakout, the price reset and established support around SAR 22.34.
Potential Reversal: The formation indicates a potential reversal to an uptrend.
Resistance and Target:
Initial Resistance: SAR 24.46
Target: Upon breaking the initial resistance of SAR 24.46, the price may test the previous top of SAR 25.85.
Pattern: Bullish Dragon Pattern
Context:
Previous Trend: The stock price was in a downtrend since reaching a peak of SAR 25.85. During this downtrend, the price made lower lows and lower highs, resting around SAR 21.
Breakout: A breakout was observed from the descending trend line.
Pattern Details:
First Candle: Long bearish candle during the downtrend.
Second Candle: Small-bodied candle that gapped down.
Third Candle: Long bullish candle that closed above the trend line at approximately SAR 22.70.
Support: After the breakout, the price reset and established support around SAR 22.34.
Potential Reversal: The formation indicates a potential reversal to an uptrend.
Resistance and Target:
Initial Resistance: SAR 24.46
Target: Upon breaking the initial resistance of SAR 24.46, the price may test the previous top of SAR 25.85.
거래청산: 타겟 닿음
면책사항
이 정보와 게시물은 TradingView에서 제공하거나 보증하는 금융, 투자, 거래 또는 기타 유형의 조언이나 권고 사항을 의미하거나 구성하지 않습니다. 자세한 내용은 이용 약관을 참고하세요.
면책사항
이 정보와 게시물은 TradingView에서 제공하거나 보증하는 금융, 투자, 거래 또는 기타 유형의 조언이나 권고 사항을 의미하거나 구성하지 않습니다. 자세한 내용은 이용 약관을 참고하세요.