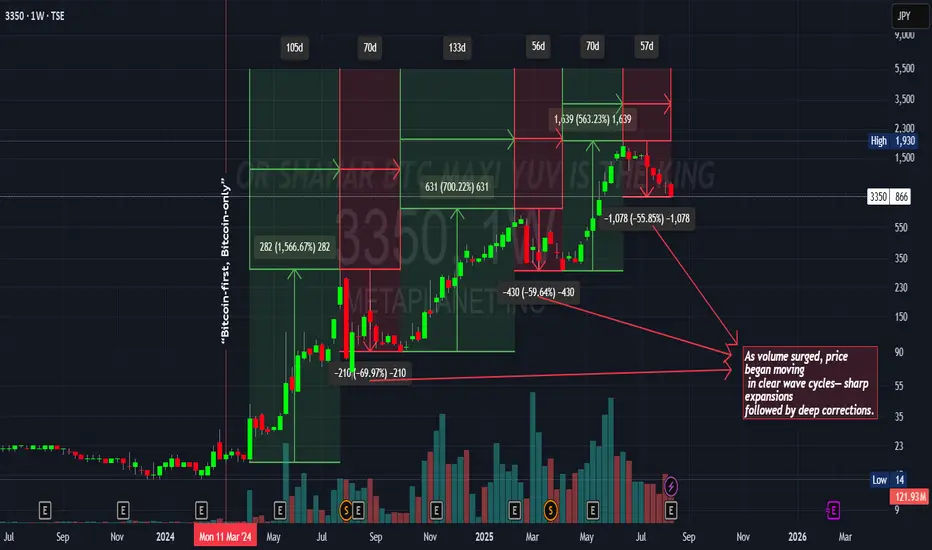
This chart highlights how price action developed in distinct wave cycles once volume surged.
Each expansion phase was sharp, delivering multi-hundred percent gains in relatively short periods.
These expansions were consistently followed by deep corrective pullbacks of 50–70%.
The repeating rhythm shows a market structure of accumulation → expansion → correction → continuation.
Overall, the cycles emphasize the importance of recognizing both momentum opportunities and the inevitable retracements that followed.
면책사항
해당 정보와 게시물은 금융, 투자, 트레이딩 또는 기타 유형의 조언이나 권장 사항으로 간주되지 않으며, 트레이딩뷰에서 제공하거나 보증하는 것이 아닙니다. 자세한 내용은 이용 약관을 참조하세요.
면책사항
해당 정보와 게시물은 금융, 투자, 트레이딩 또는 기타 유형의 조언이나 권장 사항으로 간주되지 않으며, 트레이딩뷰에서 제공하거나 보증하는 것이 아닙니다. 자세한 내용은 이용 약관을 참조하세요.