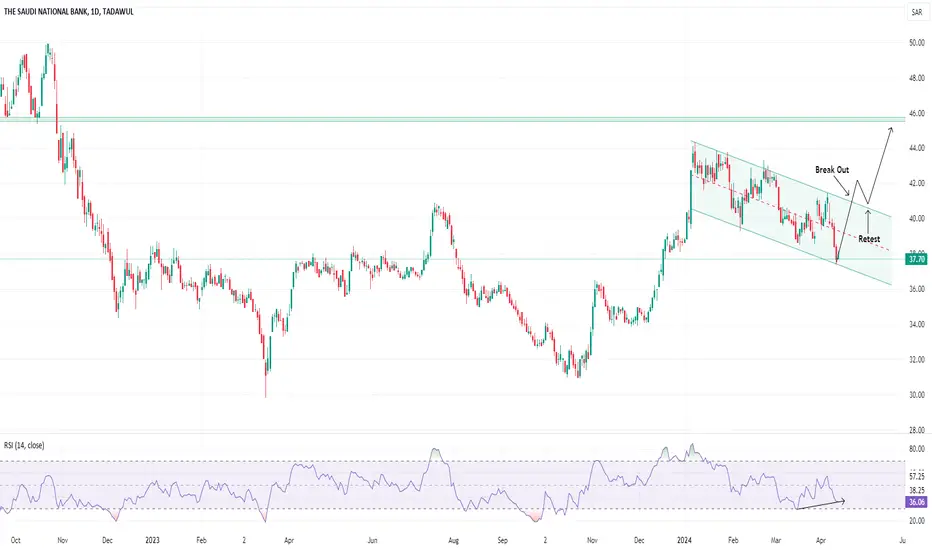
Saudi National Bank displays a promising bullish reversal pattern characterized by the formation of bullish flag pattern and divergence with RSI. Our plan entails accumulating the stock within the designated buy zone (37.50-37.70 range), while setting stop loss orders below the bottom of support around 36. Anticipation builds for a substantial surge in momentum upon the test of the trend line, anticipated around the 40.90 area. To guide our trading decisions, we've delineated two distinct targets: an immediate target around 40.90 and a final target for exiting the trade will be around 45.50 depending upon break out.
거래청산: 스탑 닿음
면책사항
이 정보와 게시물은 TradingView에서 제공하거나 보증하는 금융, 투자, 거래 또는 기타 유형의 조언이나 권고 사항을 의미하거나 구성하지 않습니다. 자세한 내용은 이용 약관을 참고하세요.
면책사항
이 정보와 게시물은 TradingView에서 제공하거나 보증하는 금융, 투자, 거래 또는 기타 유형의 조언이나 권고 사항을 의미하거나 구성하지 않습니다. 자세한 내용은 이용 약관을 참고하세요.