📈 SHIBUSDT – History Repeats Itself? Big Move Incoming! 🚀
Target 🎯: 0.1000
Stop Loss 🛑: 0.0062
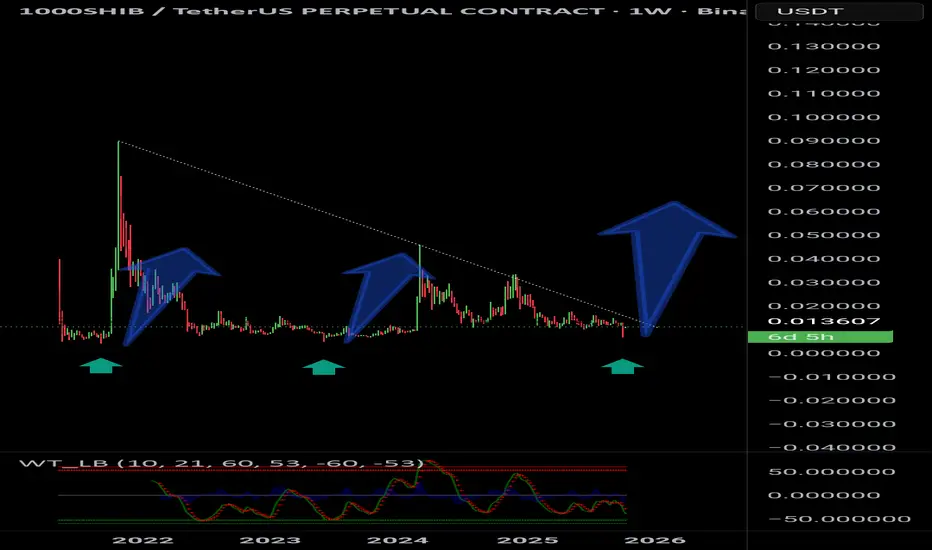
🔍 On the weekly chart, every flash crash marked with a green arrow has historically led to a massive pump in SHIB – and it's happened not once, but twice before. The pattern is clear:
Crash ➡ Consolidation ➡ Breakout
The price respects the long-term horizontal support and bounces back with exponential upside moves.
We just witnessed another flash crash, and price is once again sitting at this historical support zone. Based on the repeating structure, the probability of a strong upside breakout is high.
🔵 A breakout above the descending resistance (white dotted trendline) could trigger the next rally.
🟢 Momentum indicators at the bottom are also showing signs of bottoming out.
This setup aligns perfectly with the idea that altcoins are gearing up for a new leg up in this cycle. SHIB could be one of the early movers once again!
Target 🎯: 0.1000
Stop Loss 🛑: 0.0062
🔍 On the weekly chart, every flash crash marked with a green arrow has historically led to a massive pump in SHIB – and it's happened not once, but twice before. The pattern is clear:
Crash ➡ Consolidation ➡ Breakout
The price respects the long-term horizontal support and bounces back with exponential upside moves.
We just witnessed another flash crash, and price is once again sitting at this historical support zone. Based on the repeating structure, the probability of a strong upside breakout is high.
🔵 A breakout above the descending resistance (white dotted trendline) could trigger the next rally.
🟢 Momentum indicators at the bottom are also showing signs of bottoming out.
This setup aligns perfectly with the idea that altcoins are gearing up for a new leg up in this cycle. SHIB could be one of the early movers once again!
면책사항
이 정보와 게시물은 TradingView에서 제공하거나 보증하는 금융, 투자, 거래 또는 기타 유형의 조언이나 권고 사항을 의미하거나 구성하지 않습니다. 자세한 내용은 이용 약관을 참고하세요.
면책사항
이 정보와 게시물은 TradingView에서 제공하거나 보증하는 금융, 투자, 거래 또는 기타 유형의 조언이나 권고 사항을 의미하거나 구성하지 않습니다. 자세한 내용은 이용 약관을 참고하세요.