Studies Extending the Time Scale
The tick marks on the time scale are defined by the times in the main series.
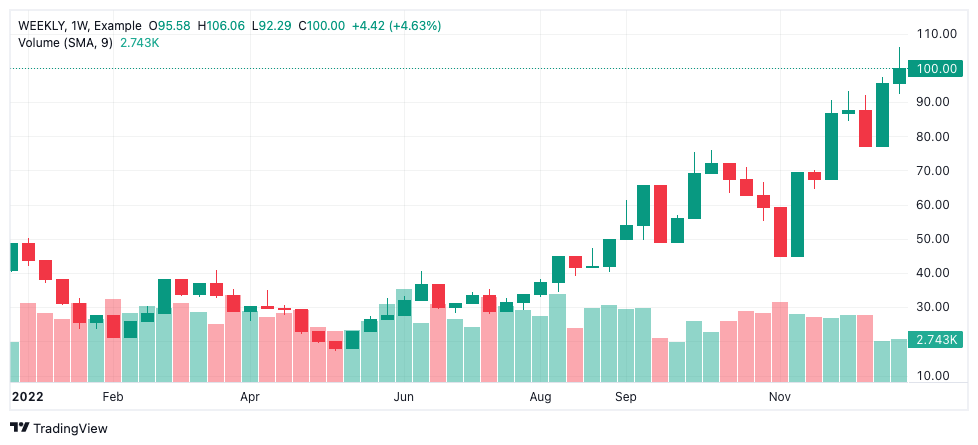
Most studies calculate their values from the bars of the main series. The simplest example of this is the Volume study - each bar of the main series has a volume associated with it and the Volume study simply shows that volume at the same time point as the bar. Because of this it is natural that the times of study values correspond 1-to-1 with the times of the main series.
For example, on this chart of weekly data we can see there is one Volume bar for each bar of the main series.
Mapping times
In some cases a study needs to calculate its values from a series of bars that are not the same as the main series. In this case it is necessary to map each study value to the time of one of the main series' bars.
Let's look at the example of the built-in Moving Average study: it is possible to provide a symbol input that is different to the symbol of the main study which the library will resolve and then use to calculate the moving average.
In this chart we have a symbol "A" for the main series, and a Moving Average study for symbol "B". We can see 5 daily bars from 2022-12-26 to 2022-12-31.
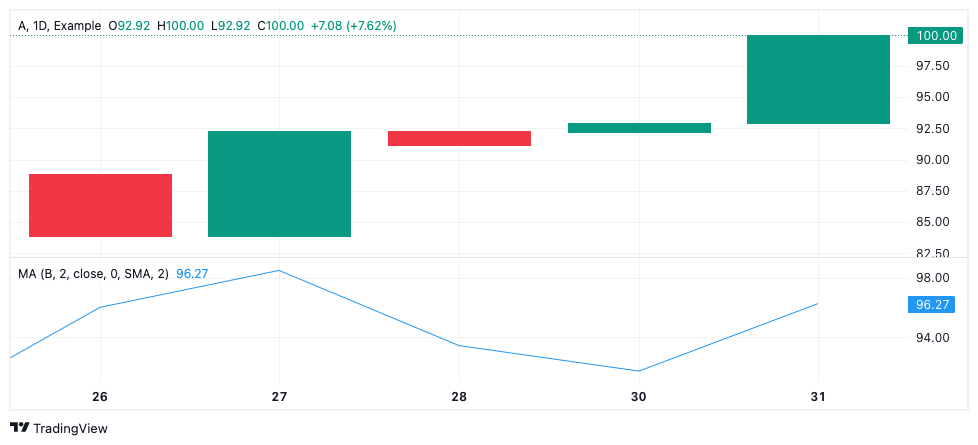
Although you cannot tell by looking at the chart in this example the symbol B actually has more bars than symbol A: symbol A is missing a bar for 2022-12-29.
| A time | B time | Shown on chart? |
|---|---|---|
| 2022-12-26 | 2022-12-26 | Yes |
| 2022-12-27 | 2022-12-27 | Yes |
| 2022-12-28 | 2022-12-28 | Yes |
| 2022-12-29 | No | |
| 2022-12-30 | 2022-12-30 | Yes |
| 2022-12-31 | 2022-12-31 | Yes |
By default studies can only display data at a time point on the chart if the main series has a bar at that time point. This is done by mapping (or "adopting") the values of the study that correspond to a time in the main series. There are two ways of mapping times from one series to another: precise and continuous.
Precise mapping
Precise mapping means that each bar time of the main series will be mapped to at most once.
| Main series time | Study time | Study value | Displayed value |
|---|---|---|---|
| 2023-01-01 | 2022-01-01 | 1.11 | 1.11 |
| 2023-01-02 | 2022-01-02 | 1.50 | 1.50 |
| 2022-01-02 | 2.30 | ||
| 2023-01-03 | 2022-01-03 | 3.00 | 3.00 |
Continuous mapping
Continuous mapping means that each main series bar time may be mapped to more than once. If the study time does not exist in the main series then the closest time greater than the study time is used.
| Main series time | Study time | Study value | Displayed value |
|---|---|---|---|
| 2023-01-01 | 2022-01-01 | 1.11 | 1.11 |
| 2023-01-02 | 2022-01-02 | 1.50 | 1.50 |
| 2022-01-02 | 2.30 | 3.00 | |
| 2023-01-03 | 2022-01-03 | 3.00 | 3.00 |
Studies extending the time scale
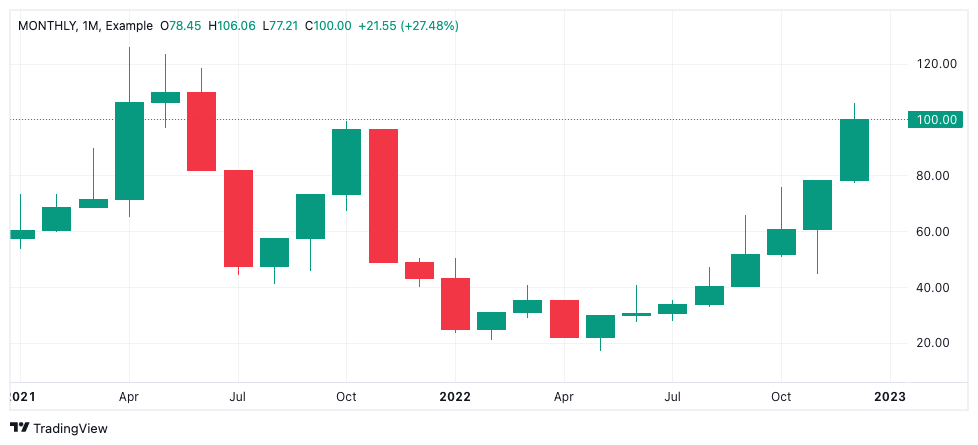
There is a feature that allows studies to also define their own points on the time scale. For studies that use this feature the restriction that the time exists in the main series is removed. This allows you to create a custom study that shows bars at a higher resolution than the main series, for example a study that shows the weekly average of a monthly symbol.
Enabling the extending time scale feature
To enable the feature for a custom study:
- Enable the
'studies_extend_time_scale'featureset. - Add
canExtendTimeScale: trueto the study's metainfo.
Example study
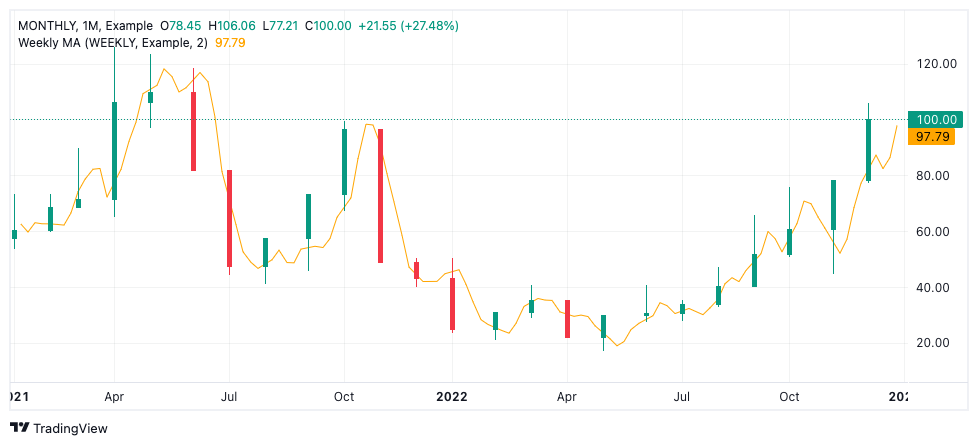
In this example if a symbol input is chosen that contains more bars than the main series the time scale will be extended to show those extra bars.
Note that the example will resolve the other symbol with the same resolution as the main series, but this can be customised by changing the resolution parameter.
{
    name: 'Extend Time Scale Example',
    metainfo: {
        id: 'Extend Time Scale Example@tv-basicstudies-1',
        name: 'Extend Time Scale Example',
        _metainfoVersion: 51,
        description: 'Extend Time Scale Example',
        shortDescription: 'Extend Time Scale Example',
        is_price_study: true,
        defaults: {
            styles: {
                plot_0: {
                    plottype: 0,
                    visible: true,
                    color: 'orange'
                },
            },
            inputs: {
                symbol: '',
            }
        },
        plots: [{
            id: 'plot_0',
            type: 'line'
        }],
        styles: {
            plot_0: {
                title: 'Plot',
            },
        },
        inputs: [
            {
                id: 'symbol',
                name: 'Other Symbol',
                type: 'symbol',
            },
        ],
        format: { type: 'inherit' },
        canExtendTimeScale: true, // important!
    },
    constructor:
        function () {
            this.init = function (ctx, inputCallback) {
                this._context = ctx;

                var symbol = inputCallback(0);
                if (symbol !== '') {
                    const resolution = PineJS.Std.period(this._context);
                    this._context.new_sym(symbol, resolution);
                }
            }

            this.main = function (ctx, inputCallback) {
                this._context = ctx;
                this._input = inputCallback;

                var symbol = inputCallback(0);

                if (symbol !== '') {
                    this._context.select_sym(1);
                }

                var close = this._context.new_var(PineJS.Std.close(this._context));

                return [close];
            };
        }
}