A following indicator is Momentum Trading that uses fast QQE crosses with Moving Averages Use for trend direction filtering. QQE or Qualitative Quantitative Estimation is based Relative strength index (RSI), but uses a smoothing technique as an additional transformation. Three crosses can be selected (all selected by default)
Strategy Kiss = 'Keep It Simple, Stupid' or 'Keep It Simple, Smart' The script simply identifies 2 consecutive Doji candles, and calculates Target on both the sides for given Reward : Risk factor. The High-Low to Open-Close ratio is set to default value 20. The Reward : Risk ratio is of default value 2. Both can be set to values of your choice. Accuracy best on...
This script indicates when the current Relative Strength Index of the last 8 closes is beyond a level from center oscillation which signals the equity is likely to reverse course. When it is the lowest RSI reading of the prior 3 readings and below 25, a green vertical bar will appear signaling a potential BUY point. Likewise, the highest reading of the prior 3 RSI...
Names: "Course Gradient Indicator" or "Punctual Deviaton of Course Gradient Indicator" or shortly "PDCG Indicator" Description: I developed this Indicator to identify potential changes in the course gradient (aka slope of course). If you want to know what kind of mathmatical operations where used for this, look at the source code below Usage: Generally, i...
Good morning Traders Inspirated by lukescream EMA-slope strategy, today I want to share with you this simple indicator whose possible use-case would be for detecting in advance possible trend reversals, specially on higher timeframes. Once that you've chosen the desired source (RSI, EMA or Stochastic k or d), the indicator will calculate its "slope"...
Hello Traders, There are several nice Linear Regression Channel scripts in the Public Library. and I tried to make one with some extra features too. This one can check if the Price breaks the channel and it shows where is was broken. Also it checks the momentum of the channel and shows it's increasing/decreasing/equal in a label, shape of the label also...
Volume based script to catch a big move. Works best on 5 min timeframe. The default sma duration for volume is set to 150 = number of candles in 5 mins timeframe for 2 days. Heavy volume is defined as = more than 9 times of sma. Both parameters are configurable. Trading strategy: Long buy at high / Short sell at low of the candle where the script gives the...
Hello Traders This script finds Tops when RSI is in overbought area or Bottoms when RSI is in oversold area and checks the divergence between them. it checks divergence at tops/bottoms after RSI exited from OB/OS areas. You can change overbought / oversold levels. You can limit the time that RSI is in OB/OS area with the option "Max Number of Bars in OB/OS" you...
Level: 1 Background One of the biggest differences between cryptocurrency and traditional financial markets is that cryptocurrency is based on blockchain technology. Individual investors can discover the direction of the flow of large funds through on-chain transfers. These large funds are often referred to as Whale. Whale can have a significant impact on the...
Level: 1 Background A trend reversal occurs when the direction of a stock (or a financial trading instrument) changes and moves back in the opposite direction. Uptrends that reverse into downtrends and downtrends that reverse into uptrends are examples of trend reversals. Function L1 Trend Reversal Indicator is simple but powerful. It can be used as a...
This indicator is made up of a stochastic oscillator and of historical volatility percentile. Historical volatility percentile basically tells you how volatile the market is based on how volatile it has been in the history. Historical volatility is great for trading options but i have also found it to be great at finding trades with good risk/reward ratio. When...
Hi All, RSI is a widely accepted indicator by most of the traders. I built this indicator to present all the RSI buying and selling signals that can be missed to get the best use of this indicator. The indicator is composed of: 1. RSI 2. Stochastic RSI 3. Linear regression for the RSI The short signals provided by the stochastic will support short term traders...
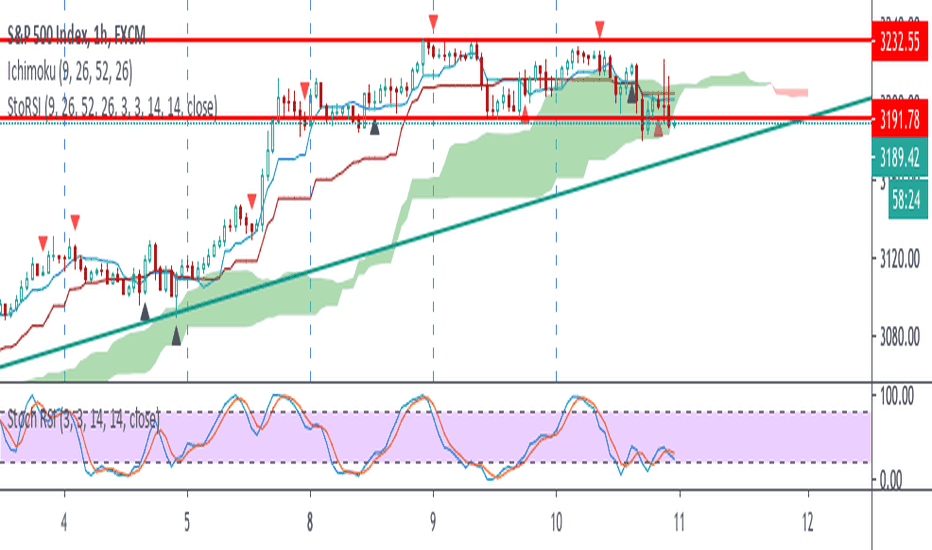
This script uses 25-75 treshold of stochastic RSI with the help of kijun-sen as confirmation, to find entry points to any trend either newly developed or an established one. I just realized it on the 1 hour SPX chart. Sure it can be used on other symbols. Crossing above/below 25/75 line of sto RSI is considered as buy/sell signal. Signals are evaluated whether...
Hello Traders, In the book "Secrets of a Pivot Boss: Revealing Proven Methods for Profiting in the Market" by Franklin Ochoa, Four different types of reversal systems were introduced and candlestick patterns are used to find reversals. I will not write a lot about the book, you should get/read it for yourself. There are many great ideas in the book, Candlesetick...
The Correlation Angle Indicator was created by John Ehlers (Stocks & Commodities V. 38:06 (8–15)) and this is technically three indicators in one so I'm splitting each one to a separate script. This particular indicator was designed for trend termination and simply buy when it is green and sell when it turns red. Let me know if you would like to see me publish...
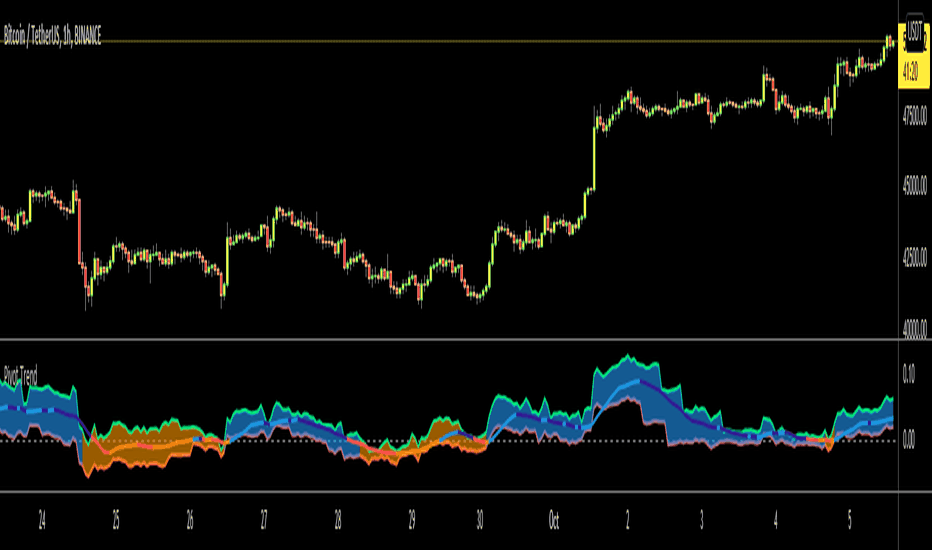
Hello Traders, Another original idea is here with you. Actualy I can say that it's a breakout strategy that uses multiple Pivot Point's averages. How it works? - it finds the Pivot Points, you can set the length as you want - it gets averages of Pivot Highs and Pivot Lows, you can set the number of Pivot Points to be included - it compares the current closing...
The Trend Analysis Indicator was created by Adam White (Stocks & Commodities V. 10:8 (358-360)) and this is not to be confused with the Trend Analysis Index which was also created by Adam White. The stock is trending when it is above the signal and loses steam when it falls below the signal. Generally you should buy when it is above it's signal and sell when it...
Hello Traders, I think you all know Donchian Channels. so I am not going to write about it. With this indicator I tried to create Donchian Trend Ribbon by using Donchian Channels. How it works ? - it calculates main trend direction by using the length that is user-defined. so you can change it as you wish - then it calculates trend direction for each 9 lower...


![[blackcat] L1 Trend Follower with Whale Pump Detection BSVUSDT: [blackcat] L1 Trend Follower with Whale Pump Detection](https://s3.tradingview.com/c/CChH8AyI_mid.png)


