PROTECTED SOURCE SCRIPT
ADR Bottom-Right TABLE Dashboard
Title: ADR Bottom-Right Dashboard
Version: 1.0
Author: [Your Name]
Description:
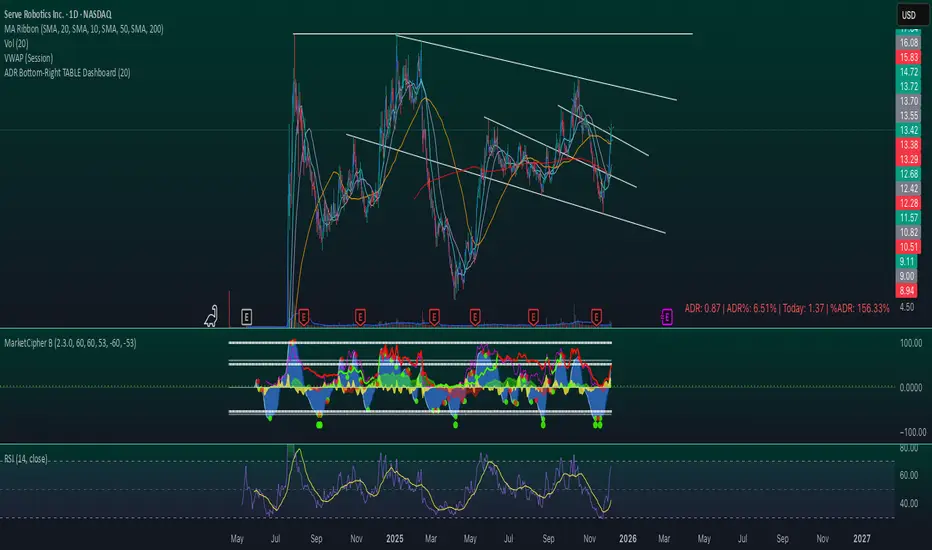
The ADR Bottom-Right Dashboard displays the Average Daily Range (ADR) and related metrics directly on your chart in a compact, easy-to-read table. It helps traders quickly see how much a stock has moved today relative to its normal daily range and identify potential overextended or trending moves.
This tool is ideal for swing traders, day traders, and scalpers who want a real-time, visual indication of volatility and intraday movement.
Features
ADR (Average Daily Range): Shows the average high-to-low movement over a customizable period (default 20 days).
ADR%: ADR as a percentage of the stock price, showing relative volatility.
Today: The current intraday range (high–low).
%ADR: How much of the ADR has already been reached today. Color-coded to indicate low, medium, or high extension.
Color coding: %ADR highlights:
Green: <50% (early-day / low volatility)
Yellow: 50–100% (normal movement)
Red: >100% (extended move / potential exhaustion)
Inputs
Input Description Default
ADR Period Number of days to calculate the ADR 20
Low %ADR Color Color for %ADR <50% Green
Medium %ADR Color Color for %ADR 50–100% Yellow
High %ADR Color Color for %ADR >100% Red
Version: 1.0
Author: [Your Name]
Description:
The ADR Bottom-Right Dashboard displays the Average Daily Range (ADR) and related metrics directly on your chart in a compact, easy-to-read table. It helps traders quickly see how much a stock has moved today relative to its normal daily range and identify potential overextended or trending moves.
This tool is ideal for swing traders, day traders, and scalpers who want a real-time, visual indication of volatility and intraday movement.
Features
ADR (Average Daily Range): Shows the average high-to-low movement over a customizable period (default 20 days).
ADR%: ADR as a percentage of the stock price, showing relative volatility.
Today: The current intraday range (high–low).
%ADR: How much of the ADR has already been reached today. Color-coded to indicate low, medium, or high extension.
Color coding: %ADR highlights:
Green: <50% (early-day / low volatility)
Yellow: 50–100% (normal movement)
Red: >100% (extended move / potential exhaustion)
Inputs
Input Description Default
ADR Period Number of days to calculate the ADR 20
Low %ADR Color Color for %ADR <50% Green
Medium %ADR Color Color for %ADR 50–100% Yellow
High %ADR Color Color for %ADR >100% Red
보호된 스크립트입니다
이 스크립트는 비공개 소스로 게시됩니다. 하지만 이를 자유롭게 제한 없이 사용할 수 있습니다 – 자세한 내용은 여기에서 확인하세요.
면책사항
해당 정보와 게시물은 금융, 투자, 트레이딩 또는 기타 유형의 조언이나 권장 사항으로 간주되지 않으며, 트레이딩뷰에서 제공하거나 보증하는 것이 아닙니다. 자세한 내용은 이용 약관을 참조하세요.
면책사항
해당 정보와 게시물은 금융, 투자, 트레이딩 또는 기타 유형의 조언이나 권장 사항으로 간주되지 않으며, 트레이딩뷰에서 제공하거나 보증하는 것이 아닙니다. 자세한 내용은 이용 약관을 참조하세요.