OPEN-SOURCE SCRIPT
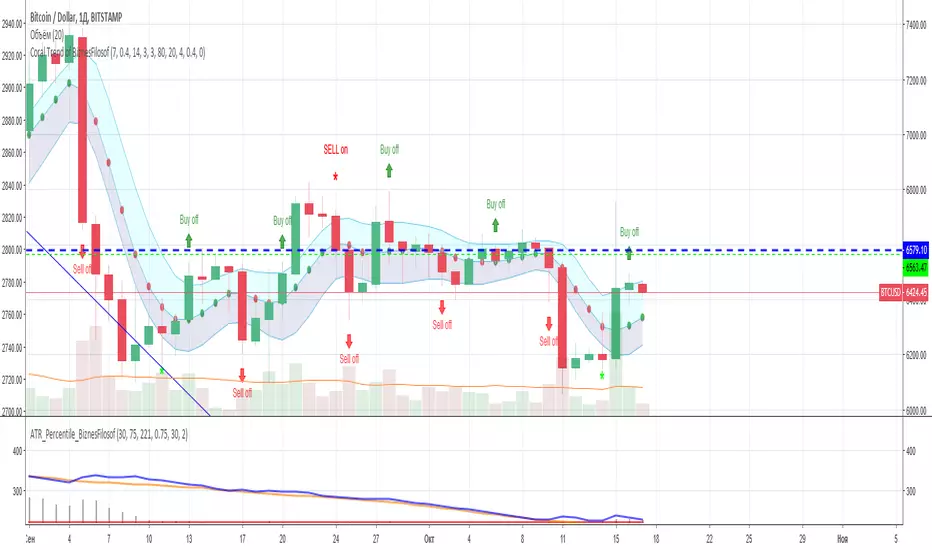
Coral Trend of BiznesFilosof
업데이트됨

This indicator is made specifically for day trading. You can trade within the day, but then you need to change the settings for your strategy.
You can enter a trade when the schedule returns to the corridor. But be sure to pay attention to the Bill Williams indicator "Alligator".
Everything is simple here: red dots are a sales trend, and green dots are a shopping trend.
For convenience, candles can be moved to the last layer.
More details on my channel in YouTube. Section "Indicators".
===
Этот индикатор сделан специально для дневной торговли. Можно торговать и внутри дня, но тогда надо изменить настройки под Вашу стратегию.
Входить в сделку можно, когда график возвращается в коридор. Но обязательно нужно обращать внимание на индикатор Билла Вильямса "Аллигатор".
Здесь всё просто: красные точки - тренд продаж, а зеленые точки - тренд покупок.
Для удобства свечи можно переместить на последний слой.
Больше подробностей на моём канале в Ютуб. Раздел "Индикаторы".
릴리즈 노트
I decided to improve the accuracy of the indicator, to find the entry point, and added Stochastic analysis. These are "BUY" and "SELL" with a "*" sign based on the analysis.===
Решил улучшить точность индикатора, для нахождения точки входа, и добавил анализ Stochastic. Это "BUY" и "SELL" со знаком "*" на базе анализа.
릴리즈 노트
It was necessary to show the opening and closing of orders, like “on” and “off”, in order to set more clarity in the indicator.===
Пришлось показать открытие и закрытие ордеров, как «on» и «off», чтобы установить больше ясности в индикатор.
오픈 소스 스크립트
진정한 TradingView 정신에 따라, 이 스크립트의 저자는 트레이더들이 이해하고 검증할 수 있도록 오픈 소스로 공개했습니다. 저자에게 박수를 보냅니다! 이 코드는 무료로 사용할 수 있지만, 출판물에서 이 코드를 재사용하는 것은 하우스 룰에 의해 관리됩니다. 님은 즐겨찾기로 이 스크립트를 차트에서 쓸 수 있습니다.
차트에 이 스크립트를 사용하시겠습니까?
면책사항
이 정보와 게시물은 TradingView에서 제공하거나 보증하는 금융, 투자, 거래 또는 기타 유형의 조언이나 권고 사항을 의미하거나 구성하지 않습니다. 자세한 내용은 이용 약관을 참고하세요.