INVITE-ONLY SCRIPT
Delta Bars [Elykia]
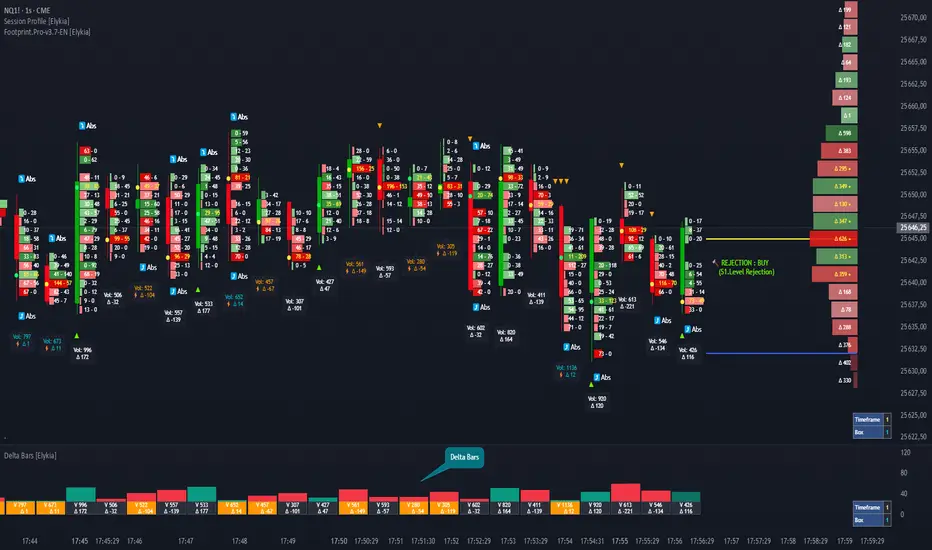
Delta Bars [Elykia] — Order Flow & Momentum Analysis
Description:
Delta Bars [Elykia] is an "Order Flow Oscillator" designed to instantly visualize buyer and seller aggression within every price move.
Unlike standard volume, it breaks down what is happening "under the hood" (Delta) and offers a clear reading of market reversals thanks to intelligent divergence detection.
🔥 Key Features:
1. Dual Calculation Mode:
2. 🧠 Smart Auto-Detection (Plug & Play):
No need to manually calculate "Box" or "Tick" sizes for each asset. The indicator automatically recognizes the asset you are trading and applies the optimal institutional calibration:
3. "Flip" Detection (Divergences) ⚡:
The indicator automatically identifies anomalies between price and Delta:
4. Technical Dashboard:
A discreet panel displays the current mode and "Box" size (in ticks/points) in real-time, ensuring you always know how the data is being filtered.
How to read the signals?
1. Green/Red Bars: They indicate Net Delta (the difference between buying and selling volume). A tall bar implies strong conviction.
2. The ⚡ Symbol (The Flip): This is the most critical signal. It appears when Delta contradicts the candle direction (e.g., Positive Delta on a Bearish candle). This indicates Absorption (passive orders blocking the move) and often precedes a reversal.
3. Range Bars Mode: Use this mode to "smooth out" the market. If the market is choppy, Range Bars will filter the noise and only draw a new bar if the price actually moves.
⚠️ Important: Replay Mode
Since this indicator performs heavy calculations (simulated tick-by-tick), it includes a safety feature for Replay Mode.
Configuration:
Description:
Delta Bars [Elykia] is an "Order Flow Oscillator" designed to instantly visualize buyer and seller aggression within every price move.
Unlike standard volume, it breaks down what is happening "under the hood" (Delta) and offers a clear reading of market reversals thanks to intelligent divergence detection.
🔥 Key Features:
1. Dual Calculation Mode:
- Timeframe Mode: Displays classic Delta based on time (e.g., 1min, 5min).
- Range Bars Mode: (Exclusive) Builds Delta bars based on price movement (volatility) rather than time. This filters out noise during consolidation periods and reveals true strength during impulses.
2. 🧠 Smart Auto-Detection (Plug & Play):
No need to manually calculate "Box" or "Tick" sizes for each asset. The indicator automatically recognizes the asset you are trading and applies the optimal institutional calibration:
- US Indices (NQ, ES, YM...)
- Forex (EURUSD, JPY...)
- Crypto (BTC, ETH)
- Commodities (Gold, Oil)
- Note: You can still switch to manual mode if needed.
3. "Flip" Detection (Divergences) ⚡:
The indicator automatically identifies anomalies between price and Delta:
- If the candle closes Green but Delta is Negative (Absorption/Failed Selling Effort).
- If the candle closes Red but Delta is Positive.
- These situations are marked with a ⚡ symbol and a specific highlight color (Orange by default), often signaling an imminent reversal.
4. Technical Dashboard:
A discreet panel displays the current mode and "Box" size (in ticks/points) in real-time, ensuring you always know how the data is being filtered.
How to read the signals?
1. Green/Red Bars: They indicate Net Delta (the difference between buying and selling volume). A tall bar implies strong conviction.
2. The ⚡ Symbol (The Flip): This is the most critical signal. It appears when Delta contradicts the candle direction (e.g., Positive Delta on a Bearish candle). This indicates Absorption (passive orders blocking the move) and often precedes a reversal.
3. Range Bars Mode: Use this mode to "smooth out" the market. If the market is choppy, Range Bars will filter the noise and only draw a new bar if the price actually moves.
⚠️ Important: Replay Mode
Since this indicator performs heavy calculations (simulated tick-by-tick), it includes a safety feature for Replay Mode.
- To use Replay: Go to settings and set the "Force Replay Date" to a date close to your starting point. This ensures maximum fluidity and avoids TradingView limit errors.
Configuration:
- Works on all timeframes but excels on seconds charts (1s, 5s) or fast minute charts (1m) for scalping.
초대 전용 스크립트
이 스크립트는 작성자가 승인한 사용자만 접근할 수 있습니다. 사용하려면 요청 후 승인을 받아야 하며, 일반적으로 결제 후에 허가가 부여됩니다. 자세한 내용은 아래 작성자의 안내를 따르거나 Elykia34에게 직접 문의하세요.
트레이딩뷰는 스크립트의 작동 방식을 충분히 이해하고 작성자를 완전히 신뢰하지 않는 이상, 해당 스크립트에 비용을 지불하거나 사용하는 것을 권장하지 않습니다. 커뮤니티 스크립트에서 무료 오픈소스 대안을 찾아보실 수도 있습니다.
작성자 지시 사항
Trading (Futures, Crypto, Forex) involves a high level of risk. This indicator is a decision-support and technical analysis tool, not investment advice. The author cannot be held responsible for any losses incurred.
면책사항
해당 정보와 게시물은 금융, 투자, 트레이딩 또는 기타 유형의 조언이나 권장 사항으로 간주되지 않으며, 트레이딩뷰에서 제공하거나 보증하는 것이 아닙니다. 자세한 내용은 이용 약관을 참조하세요.