PROTECTED SOURCE SCRIPT
Amt TDI S2 Pattern
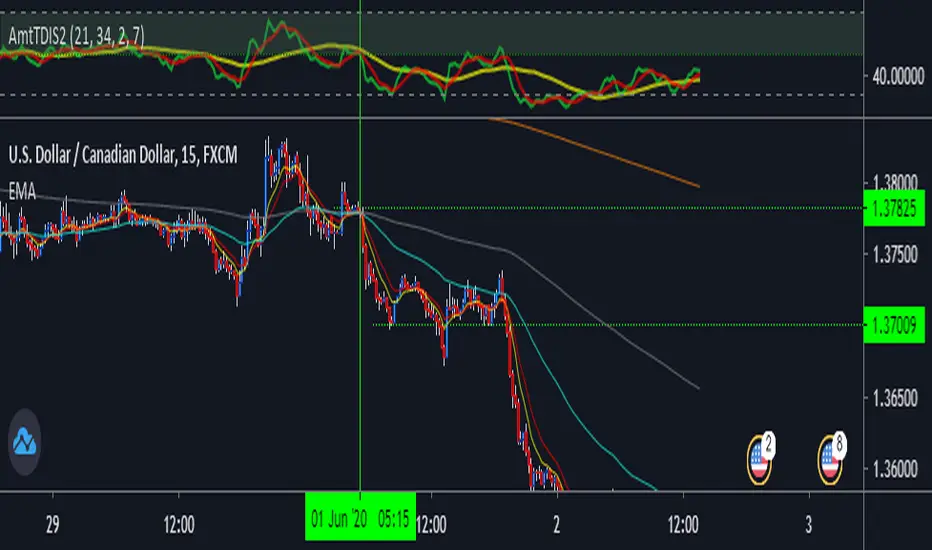
Yellow line-Liquid 50
Green Line-RSI
Red Line-Trend line
You can use it best on 15 min & 5min chart specially for intraday.
Buy Conditions-
: When yellow line is above green zone or 50.
:Green & Red line should cross or above yellow line. Green line should be above redline.
Sell Conditions-
: When yellow line is below green zone or 50.
:Green & Red line should cross or below yellow line. Green line should be below redline.
For better accuracy use it with EMA's.
NOTE- Dont use this strategy when market is sideways or very much volatile.
보호된 스크립트입니다
이 스크립트는 비공개 소스로 게시됩니다. 하지만 이를 자유롭게 제한 없이 사용할 수 있습니다 – 자세한 내용은 여기에서 확인하세요.
면책사항
해당 정보와 게시물은 금융, 투자, 트레이딩 또는 기타 유형의 조언이나 권장 사항으로 간주되지 않으며, 트레이딩뷰에서 제공하거나 보증하는 것이 아닙니다. 자세한 내용은 이용 약관을 참조하세요.
보호된 스크립트입니다
이 스크립트는 비공개 소스로 게시됩니다. 하지만 이를 자유롭게 제한 없이 사용할 수 있습니다 – 자세한 내용은 여기에서 확인하세요.
면책사항
해당 정보와 게시물은 금융, 투자, 트레이딩 또는 기타 유형의 조언이나 권장 사항으로 간주되지 않으며, 트레이딩뷰에서 제공하거나 보증하는 것이 아닙니다. 자세한 내용은 이용 약관을 참조하세요.