OPEN-SOURCE SCRIPT
Momentum-Contraction Breakout (MCB) — Indicator
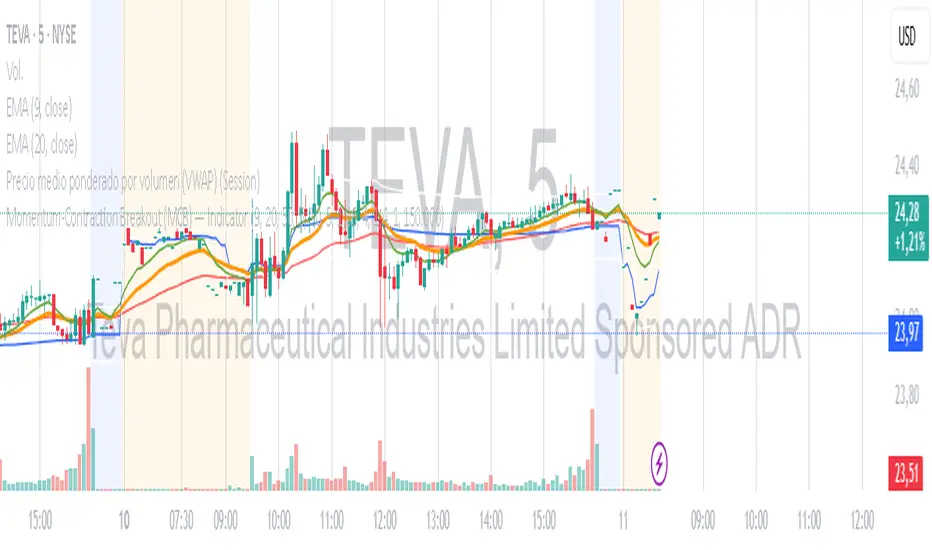
The Momentum-Contraction Breakout (MCB) indicator is designed by joan alcantara to identify high–probability bullish continuation setups based on the sequence Impulse → Contraction → Breakout.
This indicator detects stocks that:
Show early uptrend structure
The short-term EMA is above the mid-term EMA, which is above the long-term EMA, confirming momentum and trend alignment.
Enter a volatility contraction phase
Price forms a controlled pullback of 1–5 candles with decreasing true range and a tight price range, signaling reduced supply and absorption.
Break out with conviction
The breakout is validated when price closes above recent range highs, moves at least a defined % upward, and volume expands above its 20-period average.
When all conditions align, the indicator marks the breakout candle and allows alerts to be triggered.
What this indicator is useful for:
Finding momentum continuation setups early in trend development
Scanning watchlists for high-quality entries
Creating actionable trade alerts for swing and position trading
Supporting systematic setups based on volatility contraction theory
Best used on daily timeframes, but can be adapted to intraday charts when liquidity is sufficient.
오픈 소스 스크립트
트레이딩뷰의 진정한 정신에 따라, 이 스크립트의 작성자는 이를 오픈소스로 공개하여 트레이더들이 기능을 검토하고 검증할 수 있도록 했습니다. 작성자에게 찬사를 보냅니다! 이 코드는 무료로 사용할 수 있지만, 코드를 재게시하는 경우 하우스 룰이 적용된다는 점을 기억하세요.
면책사항
해당 정보와 게시물은 금융, 투자, 트레이딩 또는 기타 유형의 조언이나 권장 사항으로 간주되지 않으며, 트레이딩뷰에서 제공하거나 보증하는 것이 아닙니다. 자세한 내용은 이용 약관을 참조하세요.
오픈 소스 스크립트
트레이딩뷰의 진정한 정신에 따라, 이 스크립트의 작성자는 이를 오픈소스로 공개하여 트레이더들이 기능을 검토하고 검증할 수 있도록 했습니다. 작성자에게 찬사를 보냅니다! 이 코드는 무료로 사용할 수 있지만, 코드를 재게시하는 경우 하우스 룰이 적용된다는 점을 기억하세요.
면책사항
해당 정보와 게시물은 금융, 투자, 트레이딩 또는 기타 유형의 조언이나 권장 사항으로 간주되지 않으며, 트레이딩뷰에서 제공하거나 보증하는 것이 아닙니다. 자세한 내용은 이용 약관을 참조하세요.