OPEN-SOURCE SCRIPT
Moving Average + Candle Leverage
What if you could extract more value from each trade based on your stop loss and entry, increasing your leverage safely? Could your winning trades be even more profitable?
This indicator uses a single selectable moving average (SMA, EMA, WMA, HMA, or VWMA) to calculate safe leverage per candle, allowing traders to maximize each trade within a defined stop loss. Actual profit remains variable depending on market movement and applied leverage.
How signals appear and how leverage is determined
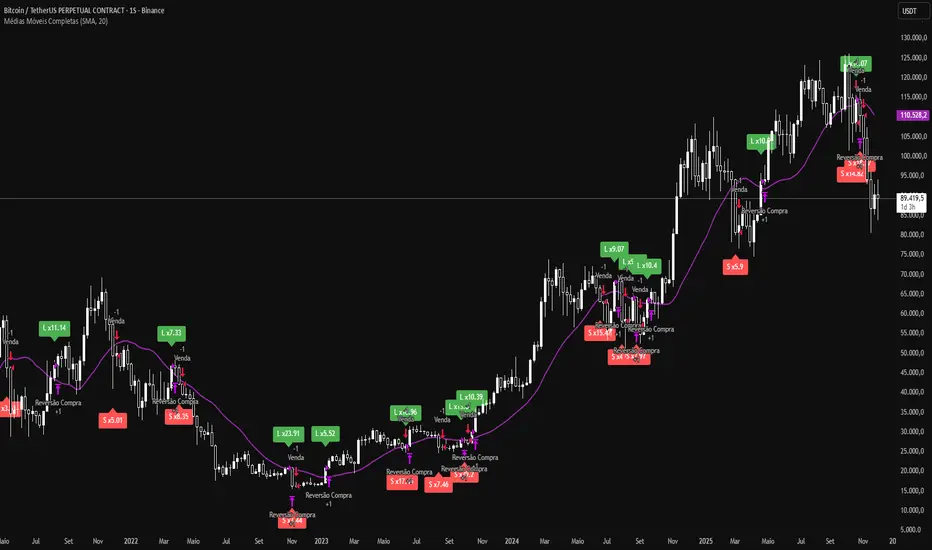
L (green): signals that price crossed above the moving average (potential long entry).
S (red): signals that price crossed below the moving average (potential short entry).
Each crossover shows a label with “x”, indicating the theoretical safe leverage for that candle.
How safe leverage is calculated:
Long: close ÷ (close − candle low)
Short: close ÷ (candle high − close)
How leverage is applied:
Identify the signal candle and record close, high, and low.
Calculate the difference between the close price and the stop price (low for Long, high for Short).
The percentage difference between these prices is our safe leverage: the smaller the difference, the higher the leverage possible, always respecting the stop loss.
The “x” label shows this maximum leverage, protecting the position balance using the candle’s stop loss.
Actual profit will still depend on market movement, but the stop loss is already defined and secure.
Main benefits:
Maximize trade potential with known stop loss
Plan entries and position sizing safely
Clearly visualize safe leverage per candle
Simple, efficient, and educational
Disclaimer:
The indicator does not execute trades automatically and is not a full trading system. It is intended solely for educational purposes and safe leverage management.
This indicator uses a single selectable moving average (SMA, EMA, WMA, HMA, or VWMA) to calculate safe leverage per candle, allowing traders to maximize each trade within a defined stop loss. Actual profit remains variable depending on market movement and applied leverage.
How signals appear and how leverage is determined
L (green): signals that price crossed above the moving average (potential long entry).
S (red): signals that price crossed below the moving average (potential short entry).
Each crossover shows a label with “x”, indicating the theoretical safe leverage for that candle.
How safe leverage is calculated:
Long: close ÷ (close − candle low)
Short: close ÷ (candle high − close)
How leverage is applied:
Identify the signal candle and record close, high, and low.
Calculate the difference between the close price and the stop price (low for Long, high for Short).
The percentage difference between these prices is our safe leverage: the smaller the difference, the higher the leverage possible, always respecting the stop loss.
The “x” label shows this maximum leverage, protecting the position balance using the candle’s stop loss.
Actual profit will still depend on market movement, but the stop loss is already defined and secure.
Main benefits:
Maximize trade potential with known stop loss
Plan entries and position sizing safely
Clearly visualize safe leverage per candle
Simple, efficient, and educational
Disclaimer:
The indicator does not execute trades automatically and is not a full trading system. It is intended solely for educational purposes and safe leverage management.
오픈 소스 스크립트
트레이딩뷰의 진정한 정신에 따라, 이 스크립트의 작성자는 이를 오픈소스로 공개하여 트레이더들이 기능을 검토하고 검증할 수 있도록 했습니다. 작성자에게 찬사를 보냅니다! 이 코드는 무료로 사용할 수 있지만, 코드를 재게시하는 경우 하우스 룰이 적용된다는 점을 기억하세요.
면책사항
해당 정보와 게시물은 금융, 투자, 트레이딩 또는 기타 유형의 조언이나 권장 사항으로 간주되지 않으며, 트레이딩뷰에서 제공하거나 보증하는 것이 아닙니다. 자세한 내용은 이용 약관을 참조하세요.
오픈 소스 스크립트
트레이딩뷰의 진정한 정신에 따라, 이 스크립트의 작성자는 이를 오픈소스로 공개하여 트레이더들이 기능을 검토하고 검증할 수 있도록 했습니다. 작성자에게 찬사를 보냅니다! 이 코드는 무료로 사용할 수 있지만, 코드를 재게시하는 경우 하우스 룰이 적용된다는 점을 기억하세요.
면책사항
해당 정보와 게시물은 금융, 투자, 트레이딩 또는 기타 유형의 조언이나 권장 사항으로 간주되지 않으며, 트레이딩뷰에서 제공하거나 보증하는 것이 아닙니다. 자세한 내용은 이용 약관을 참조하세요.