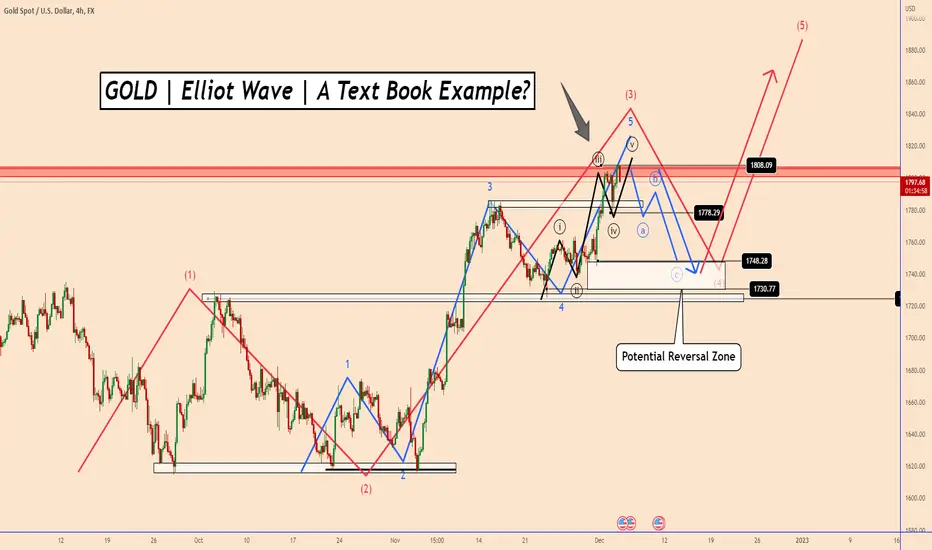
GOLD | Elliot Wave | A Text Book Example?
It is extremely rare that in reality, we find patterns in textbook examples.
Gold is currently presenting such an opportunity which I will explain in detail.
According to Elliot's Wave theory, an impulsive wave is created by 5 waves.
3 of these waves are impulsive (1,3 and 5)
2 waves are corrective (2 and 4)
According to the books, each impulsive wave is composed of 5 waves of the lower degree that can be seen in the lower chart time frames.
In our real-time example, the price has created the 3rd wave of a daily chart (in red). So it should be ready for the 4th wave correction.
If we look at the 4-hour chart, we can see that the 3rd wave can be broken down into 5 other waves (in blue)
And the 5th wave of the third wave (in blue) seems to be completed by 5 other waves (in black)
Maybe this is the moment we can see an ABC correction before the price goes up again for the 5th wave (in red).
The price correction zone is expected to be 1748 - 1730 in order for the price to rise again.
Thank you and Good Luck!
Daily Chart!

4-Hour chart:

It is extremely rare that in reality, we find patterns in textbook examples.
Gold is currently presenting such an opportunity which I will explain in detail.
According to Elliot's Wave theory, an impulsive wave is created by 5 waves.
3 of these waves are impulsive (1,3 and 5)
2 waves are corrective (2 and 4)
According to the books, each impulsive wave is composed of 5 waves of the lower degree that can be seen in the lower chart time frames.
In our real-time example, the price has created the 3rd wave of a daily chart (in red). So it should be ready for the 4th wave correction.
If we look at the 4-hour chart, we can see that the 3rd wave can be broken down into 5 other waves (in blue)
And the 5th wave of the third wave (in blue) seems to be completed by 5 other waves (in black)
Maybe this is the moment we can see an ABC correction before the price goes up again for the 5th wave (in red).
The price correction zone is expected to be 1748 - 1730 in order for the price to rise again.
Thank you and Good Luck!
Daily Chart!
4-Hour chart:
노트
노트
✅MY FREE Signals Channel
t.me/TradingPuzzles
✅Personal Telegram
t.me/KlejdiCuni
✅Suggested News Channel
t.me/ForexNewsNavigator_Official
t.me/TradingPuzzles
✅Personal Telegram
t.me/KlejdiCuni
✅Suggested News Channel
t.me/ForexNewsNavigator_Official
면책사항
해당 정보와 게시물은 금융, 투자, 트레이딩 또는 기타 유형의 조언이나 권장 사항으로 간주되지 않으며, 트레이딩뷰에서 제공하거나 보증하는 것이 아닙니다. 자세한 내용은 이용 약관을 참조하세요.