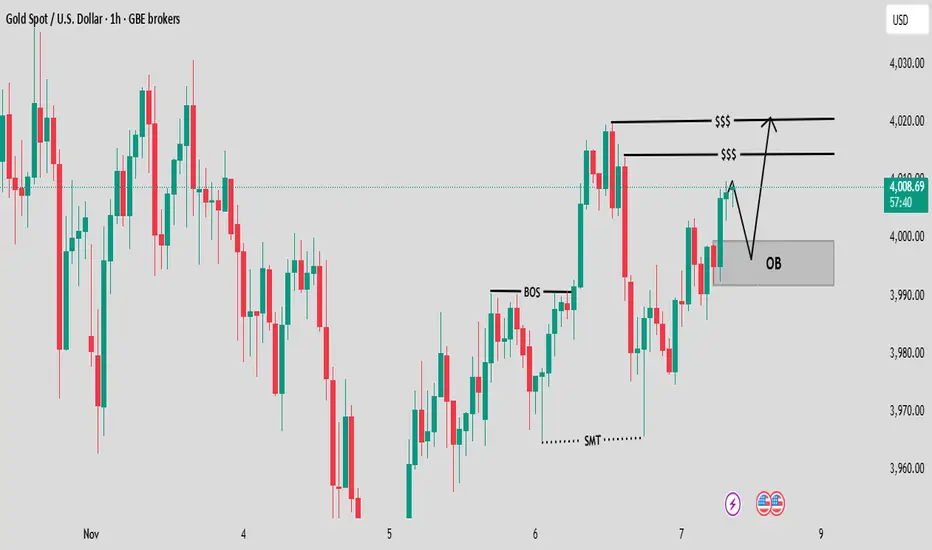
Break of Structure (BOS): There's a clear "BOS" labeled, indicating that the price has broken above a previous lower high. This is typically interpreted as a shift from a short-term downtrend (or consolidation) to an uptrend (or a structural move higher).
Order Block (OB): An "OB" (Order Block) is highlighted. This is a zone where a significant number of buy orders are believed to have been placed, making it a potential support area where price might retrace before moving higher.
Sell-Side Liquidity (BOS/$$$): The areas labeled "$$$" above the recent high represent liquidity. These are points where stop-loss orders from short sellers or pending sell orders are clustered, making them attractive targets for institutional traders to drive the price toward, often causing a quick move through that level.
Bearish Divergence (SMT): The "SMT" (Smart Money Technique) is marked, which often refers to a divergence between two correlated assets (like Gold and a US Dollar index) or a specific pattern where the low of one asset failed to reach the low of another, suggesting institutional manipulation or a short-term reversal (in this case, preceding the BOS).
Projected Move: The arrows illustrate a common trading hypothesis: the price is expected to retrace to the Order Block (OB), find support there, and then rally to take out the Sell-Side Liquidity ($$$) above the previous highs.
액티브 트레이드
면책사항
해당 정보와 게시물은 금융, 투자, 트레이딩 또는 기타 유형의 조언이나 권장 사항으로 간주되지 않으며, 트레이딩뷰에서 제공하거나 보증하는 것이 아닙니다. 자세한 내용은 이용 약관을 참조하세요.
면책사항
해당 정보와 게시물은 금융, 투자, 트레이딩 또는 기타 유형의 조언이나 권장 사항으로 간주되지 않으며, 트레이딩뷰에서 제공하거나 보증하는 것이 아닙니다. 자세한 내용은 이용 약관을 참조하세요.