🔵 US30 DOW JONES | Elite Technical Analysis & Trading Masterclass | 47,566.1 🔵
📊 INSTITUTIONAL GRADE MULTI-TIMEFRAME BREAKDOWN | NOV 3-7, 2025 FORECAST 📊
Current Level: 47,566.1 | Analysis Timestamp: November 1, 2025, 00:54 UTC+4
▬▬▬▬▬▬▬▬▬▬▬▬▬▬▬▬▬▬▬▬▬▬▬▬▬▬▬▬▬▬▬▬▬▬▬▬▬▬▬▬
🎯 EXECUTIVE MARKET BRIEFING & STRATEGIC OVERVIEW
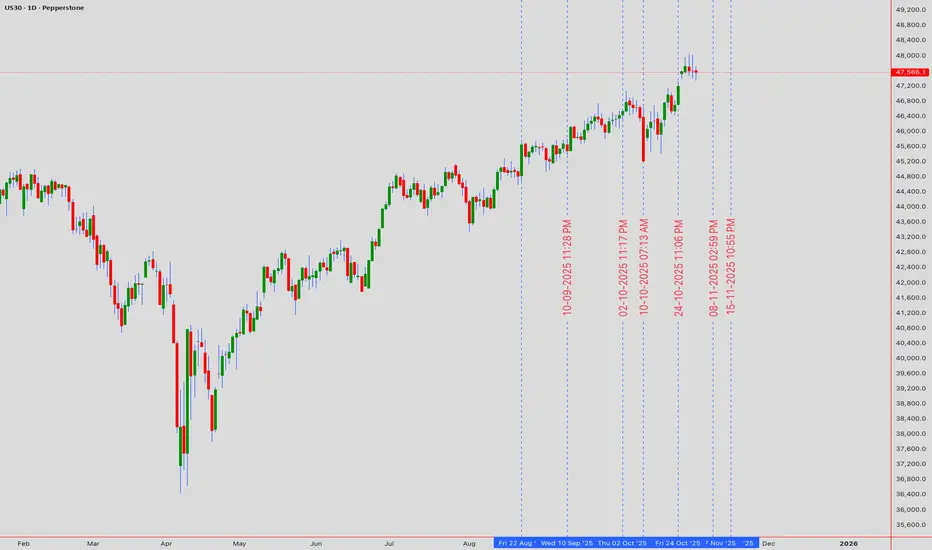
The Dow Jones Industrial Average trades at 47,566.1, positioned at a critical inflection point that will define the market's trajectory for Q4 2025. Our institutional-grade analysis reveals a bullish bias with caution as price tests the upper boundary of a major ascending channel. This week's forecast combines classical technical analysis with modern algorithmic insights to deliver precision entry and exit strategies for both scalpers and position traders.
Institutional Support Zones: 🛡️
Resistance & Target Matrix: 🎯
▬▬▬▬▬▬▬▬▬▬▬▬▬▬▬▬▬▬▬▬▬▬▬▬▬▬▬▬▬▬▬▬▬▬▬▬▬▬▬▬
📈 WEEKLY TIMEFRAME (1W) - MACRO STRUCTURE ANALYSIS
Elliott Wave Grand Supercycle: 🌊
We're navigating Intermediate Wave (3) of Primary Wave 5 within the grand supercycle. The current consolidation represents a Wave 4 triangle with explosive Wave 5 potential targeting 48,500-49,000. Alternative bearish count suggests completion of Wave B with Wave C decline risk below 47,000.
Wyckoff Method Application: 📚
Ichimoku Cloud Master Analysis: ☁️
Weekly cloud remains decisively bullish with price trading above both Senkou spans. Chikou Span shows clear space - no resistance overhead. The lagging span at 47,200 confirms the uptrend integrity. Cloud thickness of 450 points provides substantial support cushion.
Advanced Harmonic Recognition: 🦋
Developing Bullish Bat pattern with critical ratios:
- XA retracement: 0.886 at 47,350 ✅
- AB extension: 0.382-0.5 zone active
- BC projection: Targeting 1.618-2.618 at 48,200-48,500
- Pattern invalidation: Below 47,100
▬▬▬▬▬▬▬▬▬▬▬▬▬▬▬▬▬▬▬▬▬▬▬▬▬▬▬▬▬▬▬▬▬▬▬▬▬▬▬▬
📊 DAILY TIMEFRAME (1D) - SWING TRADING BLUEPRINT
Master Candle Analysis: 🕯️
Yesterday's Hammer candlestick at 47,450 support confirms buyer absorption. The long lower shadow indicates institutional accumulation. Today's confirmation above 47,600 would complete a Morning Star reversal pattern.
Chart Pattern Mastery:
Currently resolving a Symmetrical Triangle with apex at 47,600. Breakout implications:
- Upside breakout: Targets 48,150 (measured move)
- Downside break: Targets 47,100 (risk scenario)
- Volume requirement: 20% above average for validation
Bollinger Bands Strategy: 📈
Pine Script®
RSI Divergence Analysis:
Daily RSI at 58 with hidden bullish divergence detected. The RSI trend line from October lows remains intact. Overbought threshold at 70 provides 12 points of upside momentum potential.
▬▬▬▬▬▬▬▬▬▬▬▬▬▬▬▬▬▬▬▬▬▬▬▬▬▬▬▬▬▬▬▬▬▬▬▬▬▬▬▬
⚙️ 4-HOUR TIMEFRAME (4H) - TACTICAL POSITIONING
Gann Theory Application: 📐
Price respecting the 2x1 Gann angle from October low at 46,200. Current intersection at 47,550 acting as dynamic support. Next Gann resistance levels:
- 1x1 angle: 47,750
- 1x2 angle: 47,920
- Square of 9: 48,100
Dow Theory Confirmation:
Moving Average Orchestra:
Pattern Alert: ⚡
Textbook Bull Flag formation with pole from 47,200 to 47,800. Flag consolidation between 47,500-47,650. Breakout above 47,650 projects 48,250 target.
▬▬▬▬▬▬▬▬▬▬▬▬▬▬▬▬▬▬▬▬▬▬▬▬▬▬▬▬▬▬▬▬▬▬▬▬▬▬▬▬
💫 1-HOUR TIMEFRAME (1H) - INTRADAY PRECISION
Micro Pattern Development: 🔬
Inverse Head & Shoulders building:
- Left Shoulder: 47,480
- Head: 47,420
- Right Shoulder: Forming at 47,490
- Neckline: 47,580
- Target upon breakout: 47,740
VWAP Strategy Matrix:
Pine Script®
Support & Resistance Precision Map:
▬▬▬▬▬▬▬▬▬▬▬▬▬▬▬▬▬▬▬▬▬▬▬▬▬▬▬▬▬▬▬▬▬▬▬▬▬▬▬▬
⚡ 30-MINUTE SCALPING LABORATORY (30M)
Micro Structure Dynamics: 🎪
Ascending channel with precise boundaries:
- Upper channel: 47,620-47,640
- Mid-channel: 47,550-47,570
- Lower channel: 47,480-47,500
Volume Profile Insights: 📊
Point of Control (POC): 47,540
Value Area High (VAH): 47,590
Value Area Low (VAL): 47,490
High Volume Node: 47,500-47,550 (accumulation zone)
Scalping Execution Zones:
▬▬▬▬▬▬▬▬▬▬▬▬▬▬▬▬▬▬▬▬▬▬▬▬▬▬▬▬▬▬▬▬▬▬▬▬▬▬▬▬
🏃 15-MINUTE & 5-MINUTE HYPERSPEED TRADING
15-Minute Lightning Setups: ⚡
Bullish Pennant completion imminent at 47,580. Breakout targets:
- Target 1: 47,620 (+40 points)
- Target 2: 47,660 (+80 points)
- Stop Loss: 47,540 (-40 points)
5-Minute Algo Trading Signals:
Pine Script®
Session-Based Trading Plan: 🕐
▬▬▬▬▬▬▬▬▬▬▬▬▬▬▬▬▬▬▬▬▬▬▬▬▬▬▬▬▬▬▬▬▬▬▬▬▬▬▬▬
📅 WEEK AHEAD PLAYBOOK (NOVEMBER 3-7, 2025)
Monday, November 3: 🚀
Gap probability: 70% bullish to 47,620+
Strategy: Buy dips to 47,520, target 47,680
Key levels: Support 47,480, Resistance 47,700
Tuesday, November 4: 🗳️
Election Day volatility - 150+ point swings expected
Strategy: Straddle positions, tight stops
Range forecast: 47,350-47,750
Wednesday, November 5: 💥
Post-election directional breakout
Strategy: Follow the breakout with size
Bullish above 47,800, Bearish below 47,300
Thursday, November 6: 📊
Fed speak and data releases
Strategy: Fade extremes with mean reversion
Expected range: 47,500-47,900
Friday, November 7: 🎯
Weekly options expiry - gamma pinning likely
Strategy: Sell premium around 47,750 strike
Weekly close above 47,750 = Bullish continuation
▬▬▬▬▬▬▬▬▬▬▬▬▬▬▬▬▬▬▬▬▬▬▬▬▬▬▬▬▬▬▬▬▬▬▬▬▬▬▬▬
⚖️ PROFESSIONAL RISK MANAGEMENT FRAMEWORK
Intraday Risk Protocol: 🛡️
Swing Position Architecture: 📈
▬▬▬▬▬▬▬▬▬▬▬▬▬▬▬▬▬▬▬▬▬▬▬▬▬▬▬▬▬▬▬▬▬▬▬▬▬▬▬▬
🔴 BEARISH CONTINGENCY & RISK SCENARIOS
Invalidation Triggers: 🐻
Black Swan Risk Matrix: 🦢
• Geopolitical escalation (200+ point gaps)
• Federal Reserve surprise (150+ point moves)
• Corporate earnings shocks (100+ point swings)
• Technical failures (flash crashes)
• Algorithmic liquidations (cascading stops)
▬▬▬▬▬▬▬▬▬▬▬▬▬▬▬▬▬▬▬▬▬▬▬▬▬▬▬▬▬▬▬▬▬▬▬▬▬▬▬▬
🎯 HIGH-CONVICTION CONFLUENCE ZONES
Golden Buy Zone: ✅
47,450-47,500
(Multi-timeframe support + Fibonacci cluster + Volume POC + Moving average confluence)
Premium Sell Zone: ❌
47,850-47,900
(Major resistance + Pattern targets + Round number + Weekly R1 pivot)
Breakout Confirmation: 🚀
47,680-47,720
(Triangle breakout + Flag completion + Bollinger Band penetration)
▬▬▬▬▬▬▬▬▬▬▬▬▬▬▬▬▬▬▬▬▬▬▬▬▬▬▬▬▬▬▬▬▬▬▬▬▬▬▬▬
💎 MASTER TRADER'S FINAL VERDICT
The Dow Jones at 47,566.1 presents a high-probability bullish setup with clearly defined risk parameters. The convergence of technical indicators, pattern completions, and volume dynamics creates an asymmetric risk-reward opportunity favoring longs above 47,450.
Week's Best Trade Setups: 🏆
Success Keys: 🔑
Trade with the trend, but protect your capital. Size positions appropriately. Honor stop losses religiously. Let winners run with trailing stops.
▬▬▬▬▬▬▬▬▬▬▬▬▬▬▬▬▬▬▬▬▬▬▬▬▬▬▬▬▬▬▬▬▬▬▬▬▬▬▬▬
#US30 #DowJones #DJI #TechnicalAnalysis #Trading #StockMarket #Indices #DayTrading #SwingTrading #ElliottWave #Wyckoff #GannTheory #PriceAction #TradingStrategy #MarketAnalysis #InstitutionalTrading #OrderFlow #VolumeProfile #TradingView #SPX500 #MarketForecast
🔔 Follow for Institutional-Grade Analysis Daily! | Excellence in Execution 📊
Risk Disclosure: Trading involves substantial risk. Past performance is not indicative of future results. Always conduct thorough research and implement strict risk management protocols.
📊 INSTITUTIONAL GRADE MULTI-TIMEFRAME BREAKDOWN | NOV 3-7, 2025 FORECAST 📊
Current Level: 47,566.1 | Analysis Timestamp: November 1, 2025, 00:54 UTC+4
▬▬▬▬▬▬▬▬▬▬▬▬▬▬▬▬▬▬▬▬▬▬▬▬▬▬▬▬▬▬▬▬▬▬▬▬▬▬▬▬
🎯 EXECUTIVE MARKET BRIEFING & STRATEGIC OVERVIEW
The Dow Jones Industrial Average trades at 47,566.1, positioned at a critical inflection point that will define the market's trajectory for Q4 2025. Our institutional-grade analysis reveals a bullish bias with caution as price tests the upper boundary of a major ascending channel. This week's forecast combines classical technical analysis with modern algorithmic insights to deliver precision entry and exit strategies for both scalpers and position traders.
Institutional Support Zones: 🛡️
- Primary Defense: 47,450 - 47,480 (High-frequency algo support)
- Secondary Buffer: 47,350 - 47,380 (Volume-weighted anchor)
- Critical Floor: 47,200 - 47,250 (Weekly pivot cluster)
- Major Foundation: 47,000 - 47,050 (Psychological & structural)
Resistance & Target Matrix: 🎯
- Immediate Cap: 47,650 - 47,680 (Intraday supply zone)
- Secondary Barrier: 47,750 - 47,800 (Daily resistance band)
- Breakout Zone: 47,900 - 47,950 (Pattern completion area)
- Major Target: 48,100 - 48,150 (Weekly extension objective)
▬▬▬▬▬▬▬▬▬▬▬▬▬▬▬▬▬▬▬▬▬▬▬▬▬▬▬▬▬▬▬▬▬▬▬▬▬▬▬▬
📈 WEEKLY TIMEFRAME (1W) - MACRO STRUCTURE ANALYSIS
Elliott Wave Grand Supercycle: 🌊
We're navigating Intermediate Wave (3) of Primary Wave 5 within the grand supercycle. The current consolidation represents a Wave 4 triangle with explosive Wave 5 potential targeting 48,500-49,000. Alternative bearish count suggests completion of Wave B with Wave C decline risk below 47,000.
Wyckoff Method Application: 📚
Current Phase: Late Stage Re-Accumulation
- Preliminary Support (PS): 46,800
- Selling Climax (SC): 46,500
- Automatic Rally (AR): 47,800
- Secondary Test (ST): Successfully held 46,900
Next: Sign of Strength (SOS) breakout above 47,800
Ichimoku Cloud Master Analysis: ☁️
Weekly cloud remains decisively bullish with price trading above both Senkou spans. Chikou Span shows clear space - no resistance overhead. The lagging span at 47,200 confirms the uptrend integrity. Cloud thickness of 450 points provides substantial support cushion.
Advanced Harmonic Recognition: 🦋
Developing Bullish Bat pattern with critical ratios:
- XA retracement: 0.886 at 47,350 ✅
- AB extension: 0.382-0.5 zone active
- BC projection: Targeting 1.618-2.618 at 48,200-48,500
- Pattern invalidation: Below 47,100
▬▬▬▬▬▬▬▬▬▬▬▬▬▬▬▬▬▬▬▬▬▬▬▬▬▬▬▬▬▬▬▬▬▬▬▬▬▬▬▬
📊 DAILY TIMEFRAME (1D) - SWING TRADING BLUEPRINT
Master Candle Analysis: 🕯️
Yesterday's Hammer candlestick at 47,450 support confirms buyer absorption. The long lower shadow indicates institutional accumulation. Today's confirmation above 47,600 would complete a Morning Star reversal pattern.
Chart Pattern Mastery:
Currently resolving a Symmetrical Triangle with apex at 47,600. Breakout implications:
- Upside breakout: Targets 48,150 (measured move)
- Downside break: Targets 47,100 (risk scenario)
- Volume requirement: 20% above average for validation
Bollinger Bands Strategy: 📈
Upper Band: 47,720 (resistance)
Middle Band (20 SMA): 47,480 (support)
Lower Band: 47,240 (oversold zone)
Band Width: Contracting - Squeeze imminent
%B Reading: 0.72 (bullish momentum)
RSI Divergence Analysis:
Daily RSI at 58 with hidden bullish divergence detected. The RSI trend line from October lows remains intact. Overbought threshold at 70 provides 12 points of upside momentum potential.
▬▬▬▬▬▬▬▬▬▬▬▬▬▬▬▬▬▬▬▬▬▬▬▬▬▬▬▬▬▬▬▬▬▬▬▬▬▬▬▬
⚙️ 4-HOUR TIMEFRAME (4H) - TACTICAL POSITIONING
Gann Theory Application: 📐
Price respecting the 2x1 Gann angle from October low at 46,200. Current intersection at 47,550 acting as dynamic support. Next Gann resistance levels:
- 1x1 angle: 47,750
- 1x2 angle: 47,920
- Square of 9: 48,100
Dow Theory Confirmation:
- Primary Trend: Bullish (higher highs/lows intact)
- Secondary Trend: Consolidation phase
- Minor Trend: Testing resistance
- Volume Confirmation: Accumulation on dips
- Breadth Analysis: 70% of Dow components bullish
Moving Average Orchestra:
- EMA 20: 47,520 (immediate support)
- EMA 50: 47,440 (strong support)
- SMA 100: 47,350 (critical support)
- SMA 200: 47,180 (major trend support)
Pattern Alert: ⚡
Textbook Bull Flag formation with pole from 47,200 to 47,800. Flag consolidation between 47,500-47,650. Breakout above 47,650 projects 48,250 target.
▬▬▬▬▬▬▬▬▬▬▬▬▬▬▬▬▬▬▬▬▬▬▬▬▬▬▬▬▬▬▬▬▬▬▬▬▬▬▬▬
💫 1-HOUR TIMEFRAME (1H) - INTRADAY PRECISION
Micro Pattern Development: 🔬
Inverse Head & Shoulders building:
- Left Shoulder: 47,480
- Head: 47,420
- Right Shoulder: Forming at 47,490
- Neckline: 47,580
- Target upon breakout: 47,740
VWAP Strategy Matrix:
Daily VWAP: 47,535
Weekly VWAP: 47,485
Monthly VWAP: 47,320
Upper Band 1: 47,610 (first target)
Upper Band 2: 47,685 (second target)
Lower Band 1: 47,460 (first support)
Support & Resistance Precision Map:
R3: 47,750 | R2: 47,680 | R1: 47,620
PIVOT: 47,566 (current price)
S1: 47,510 | S2: 47,450 | S3: 47,380
▬▬▬▬▬▬▬▬▬▬▬▬▬▬▬▬▬▬▬▬▬▬▬▬▬▬▬▬▬▬▬▬▬▬▬▬▬▬▬▬
⚡ 30-MINUTE SCALPING LABORATORY (30M)
Micro Structure Dynamics: 🎪
Ascending channel with precise boundaries:
- Upper channel: 47,620-47,640
- Mid-channel: 47,550-47,570
- Lower channel: 47,480-47,500
Volume Profile Insights: 📊
Point of Control (POC): 47,540
Value Area High (VAH): 47,590
Value Area Low (VAL): 47,490
High Volume Node: 47,500-47,550 (accumulation zone)
Scalping Execution Zones:
- Long Zone A: 47,520-47,530 (VWAP test)
- Long Zone B: 47,490-47,500 (channel bottom)
- Short Zone A: 47,620-47,630 (channel top)
- Short Zone B: 47,680-47,690 (resistance cluster)
▬▬▬▬▬▬▬▬▬▬▬▬▬▬▬▬▬▬▬▬▬▬▬▬▬▬▬▬▬▬▬▬▬▬▬▬▬▬▬▬
🏃 15-MINUTE & 5-MINUTE HYPERSPEED TRADING
15-Minute Lightning Setups: ⚡
Bullish Pennant completion imminent at 47,580. Breakout targets:
- Target 1: 47,620 (+40 points)
- Target 2: 47,660 (+80 points)
- Stop Loss: 47,540 (-40 points)
5-Minute Algo Trading Signals:
Entry Triggers:
- RSI < 30 + VWAP touch = Long signal
- RSI > 70 + Resistance = Short signal
- MACD crossover + Volume spike = Trend entry
Exit Rules:
- 20-point profit target OR
- RSI extremes (>80 or <20) OR
- VWAP band 2 touch
Session-Based Trading Plan: 🕐
- Asian Session: Range 47,520-47,580 (60 points)
- London Open: Breakout potential above 47,600
- NY Premarket: Volatility increase to 80+ points
- NY Session: Directional move 100+ points
- NY Close: Position squaring near 47,550
▬▬▬▬▬▬▬▬▬▬▬▬▬▬▬▬▬▬▬▬▬▬▬▬▬▬▬▬▬▬▬▬▬▬▬▬▬▬▬▬
📅 WEEK AHEAD PLAYBOOK (NOVEMBER 3-7, 2025)
Monday, November 3: 🚀
Gap probability: 70% bullish to 47,620+
Strategy: Buy dips to 47,520, target 47,680
Key levels: Support 47,480, Resistance 47,700
Tuesday, November 4: 🗳️
Election Day volatility - 150+ point swings expected
Strategy: Straddle positions, tight stops
Range forecast: 47,350-47,750
Wednesday, November 5: 💥
Post-election directional breakout
Strategy: Follow the breakout with size
Bullish above 47,800, Bearish below 47,300
Thursday, November 6: 📊
Fed speak and data releases
Strategy: Fade extremes with mean reversion
Expected range: 47,500-47,900
Friday, November 7: 🎯
Weekly options expiry - gamma pinning likely
Strategy: Sell premium around 47,750 strike
Weekly close above 47,750 = Bullish continuation
▬▬▬▬▬▬▬▬▬▬▬▬▬▬▬▬▬▬▬▬▬▬▬▬▬▬▬▬▬▬▬▬▬▬▬▬▬▬▬▬
⚖️ PROFESSIONAL RISK MANAGEMENT FRAMEWORK
Intraday Risk Protocol: 🛡️
- Position size: 1-2% risk per trade maximum
- Risk-Reward: Minimum 1:2, target 1:3
- Daily loss limit: -3% circuit breaker
- Consecutive losses: Max 3, then stop
- Profit protection: Trail stop at 50% of max profit
- Break-even: Move stop to entry at +30 points
Swing Position Architecture: 📈
- Core position: 40% at 47,450-47,500
- Scale-in levels: 30% at 47,350, 30% at 47,250
- Stop loss: Below 47,150 (all positions)
- Target 1: 47,850 (30% exit)
- Target 2: 48,100 (40% exit)
- Target 3: 48,350 (20% exit)
- Runner: 48,500+ (10% moon bag)
▬▬▬▬▬▬▬▬▬▬▬▬▬▬▬▬▬▬▬▬▬▬▬▬▬▬▬▬▬▬▬▬▬▬▬▬▬▬▬▬
🔴 BEARISH CONTINGENCY & RISK SCENARIOS
Invalidation Triggers: 🐻
- Hourly close below 47,450 = Caution signal
- 4H close below 47,350 = Bearish shift likely
- Daily close below 47,200 = Trend reversal warning
- Weekly close below 47,000 = Major bearish confirmation
Black Swan Risk Matrix: 🦢
• Geopolitical escalation (200+ point gaps)
• Federal Reserve surprise (150+ point moves)
• Corporate earnings shocks (100+ point swings)
• Technical failures (flash crashes)
• Algorithmic liquidations (cascading stops)
▬▬▬▬▬▬▬▬▬▬▬▬▬▬▬▬▬▬▬▬▬▬▬▬▬▬▬▬▬▬▬▬▬▬▬▬▬▬▬▬
🎯 HIGH-CONVICTION CONFLUENCE ZONES
Golden Buy Zone: ✅
47,450-47,500
(Multi-timeframe support + Fibonacci cluster + Volume POC + Moving average confluence)
Premium Sell Zone: ❌
47,850-47,900
(Major resistance + Pattern targets + Round number + Weekly R1 pivot)
Breakout Confirmation: 🚀
47,680-47,720
(Triangle breakout + Flag completion + Bollinger Band penetration)
▬▬▬▬▬▬▬▬▬▬▬▬▬▬▬▬▬▬▬▬▬▬▬▬▬▬▬▬▬▬▬▬▬▬▬▬▬▬▬▬
💎 MASTER TRADER'S FINAL VERDICT
The Dow Jones at 47,566.1 presents a high-probability bullish setup with clearly defined risk parameters. The convergence of technical indicators, pattern completions, and volume dynamics creates an asymmetric risk-reward opportunity favoring longs above 47,450.
Week's Best Trade Setups: 🏆
- Swing Long: 47,450-47,500 zone → Target: 48,100
- Breakout Long: Above 47,680 → Target: 47,900
- Scalp Long: VWAP touches at 47,535 → Target: 47,620
Success Keys: 🔑
Trade with the trend, but protect your capital. Size positions appropriately. Honor stop losses religiously. Let winners run with trailing stops.
"In trading, the disciplined mind triumphs over the brilliant mind" - Master the process, profits follow! 💰
▬▬▬▬▬▬▬▬▬▬▬▬▬▬▬▬▬▬▬▬▬▬▬▬▬▬▬▬▬▬▬▬▬▬▬▬▬▬▬▬
#US30 #DowJones #DJI #TechnicalAnalysis #Trading #StockMarket #Indices #DayTrading #SwingTrading #ElliottWave #Wyckoff #GannTheory #PriceAction #TradingStrategy #MarketAnalysis #InstitutionalTrading #OrderFlow #VolumeProfile #TradingView #SPX500 #MarketForecast
🔔 Follow for Institutional-Grade Analysis Daily! | Excellence in Execution 📊
Risk Disclosure: Trading involves substantial risk. Past performance is not indicative of future results. Always conduct thorough research and implement strict risk management protocols.
I am nothing @shunya.trade
면책사항
이 정보와 게시물은 TradingView에서 제공하거나 보증하는 금융, 투자, 거래 또는 기타 유형의 조언이나 권고 사항을 의미하거나 구성하지 않습니다. 자세한 내용은 이용 약관을 참고하세요.
I am nothing @shunya.trade
면책사항
이 정보와 게시물은 TradingView에서 제공하거나 보증하는 금융, 투자, 거래 또는 기타 유형의 조언이나 권고 사항을 의미하거나 구성하지 않습니다. 자세한 내용은 이용 약관을 참고하세요.