TOTAL3 Market Cap (Crypto Total Market Cap Excluding BTC and ETH
TOTAL3 Market Cap (Crypto Total Market Cap Excluding BTC and ETH).
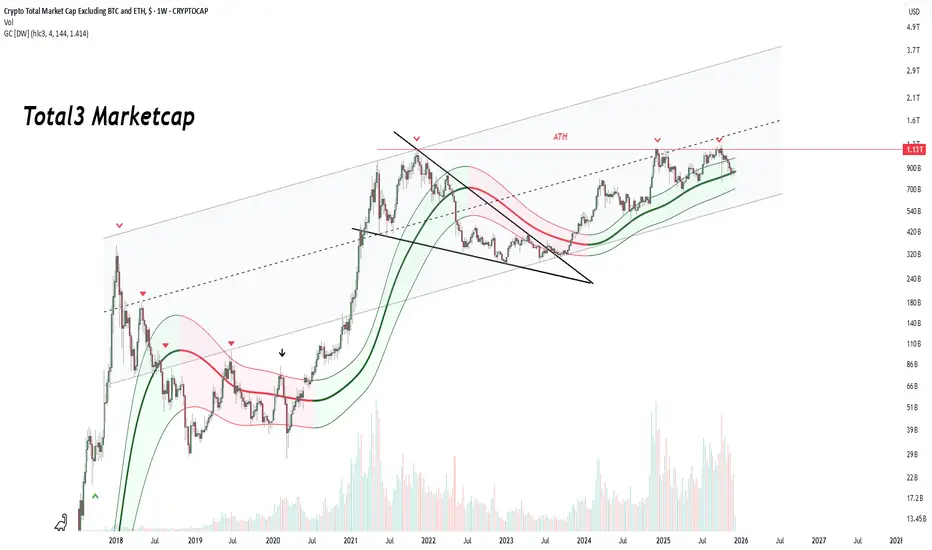
In simple terms, this chart represents the health and trend of the Altcoin Market.
1. Market Structure: The Macro View
The chart shows a clear, long-term bullish progression within a large ascending parallel channel (the dotted upper and lower lines).
The Trend: Since 2018, despite massive volatility, the "higher lows" structure remains intact. The market is trending upward over the multi-year timeframe.
Current Location: The price is currently trading in the upper half of this channel, suggesting strong momentum but also indicating we are approaching historical resistance zones.
2. Indicator Analysis: The Gaussian Channel
The colored ribbon flowing through the price action is likely a Gaussian Channel (GC), which is a momentum indicator.
Green Band: Indicates a bullish trend. Notice how the band turned green in late 2023/early 2024. The price has been "surfing" the top of this green band, using it as dynamic support. This is a classic characteristic of a strong bull run.
Red Band: Represents the bear market (2022). The flip from Red to Green is a major "buy" signal for long-term holders.
3. Key Patterns & Breakouts
The Wedge Breakout: There are black trendlines forming a falling wedge or triangle pattern during the 2021-2023 correction. The price decisively broke out of this structure to the upside, confirming the end of the bear market.
The Dashed Resistance: There is a dashed diagonal line connecting the 2021 highs to the current price action. The market cap is currently pressing right up against this diagonal resistance. A clean break above this line is usually the precursor to an explosive move.
4. Critical Levels to Watch
Resistance (The Ceiling):
$1.13 Trillion (ATH): marked by the red horizontal line. This is the All-Time High from the 2021 peak. This is the most critical level on the chart. If TOTAL3 breaks and closes above $1.13T, the market enters "Price Discovery," which is often when the most aggressive "Altseason" rallies occur.
Current Support (The Floor):
The Green Ribbon (~$700B - $800B): If the price gets rejected at the current resistance, it will likely pull back to test the top of the green Gaussian band. As long as the price stays above the green band, the macro trend remains bullish.
Summary
The chart depicts an Altcoin market that has successfully exited a bear market and is currently in a mid-cycle accumulation/markup phase.
A breakout above the dashed trendline and subsequently the $1.13T ATH level would signal the start of a parabolic phase.
The Correlation: TOTAL3 vs. ETH/BTC
There is currently a massive divergence:
TOTAL3 is attacking ATHs ($1.13T).
ETH/BTC is at multi-year lows.
This divergence is bullish for ETH. It implies that the Altcoin rally has been driven by "Others" (Solana, mid-caps, etc.), and capital has not yet rotated back into Ethereum. When TOTAL3 breaks its resistance (the dashed line in your image), profits typically rotate from high-risk alts back into ETH, causing the ETH/BTC pair to launch vertically from this 0.035 support.
면책사항
해당 정보와 게시물은 금융, 투자, 트레이딩 또는 기타 유형의 조언이나 권장 사항으로 간주되지 않으며, 트레이딩뷰에서 제공하거나 보증하는 것이 아닙니다. 자세한 내용은 이용 약관을 참조하세요.
면책사항
해당 정보와 게시물은 금융, 투자, 트레이딩 또는 기타 유형의 조언이나 권장 사항으로 간주되지 않으며, 트레이딩뷰에서 제공하거나 보증하는 것이 아닙니다. 자세한 내용은 이용 약관을 참조하세요.