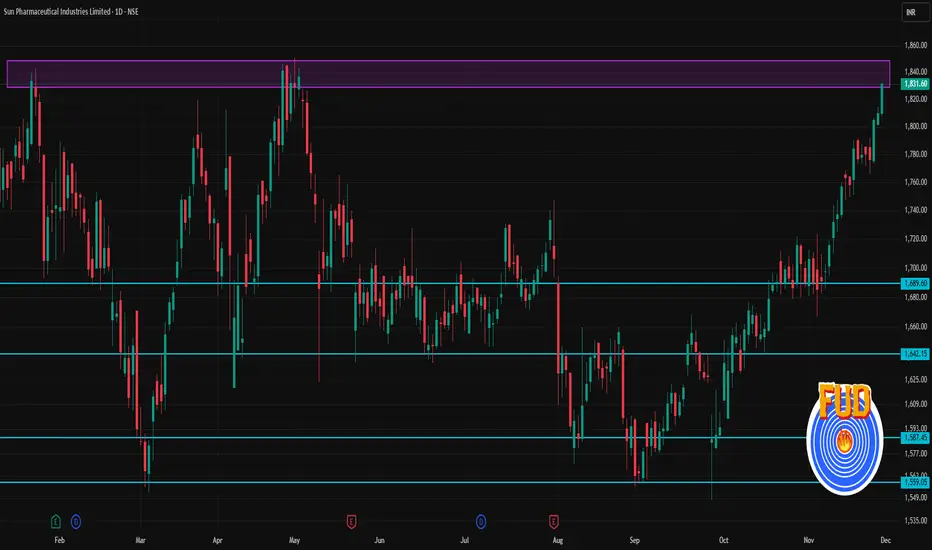
📈 Key numbers & technical indicators
Last close: ~₹ 1,831.60
Pivot point: ~₹ 1,824.03
Immediate resistance (R1‑R3): ~₹ 1,840.6 → ₹ 1,849.5 → ₹ 1,866.1
Immediate support (S1‑S3): ~₹ 1,815.1 → ₹ 1,798.5 → ₹ 1,789.6
Moving averages: 20‑day ~₹ 1,758.6, 50‑day ~₹ 1,711.7, 100‑day ~₹ 1,690.8, 200‑day ~₹ 1,686.6 — stock is comfortably above all, indicating overall bullishness.
✅ What this suggests now (1‑day / short‑term view)
As long as price stays above pivot (~₹ 1,824), the near‑term bias remains mildly bullish.
If price breaks and sustains above first resistance levels (~₹ 1,840–1,850), next resistance zone near ~₹ 1,865 may come into play.
On downside, if price slips below support zone (~₹ 1,815–₹ 1,798), watch for further weakness toward ~₹ 1,789–₹ 1,775.
관련 발행물
면책사항
해당 정보와 게시물은 금융, 투자, 트레이딩 또는 기타 유형의 조언이나 권장 사항으로 간주되지 않으며, 트레이딩뷰에서 제공하거나 보증하는 것이 아닙니다. 자세한 내용은 이용 약관을 참조하세요.
관련 발행물
면책사항
해당 정보와 게시물은 금융, 투자, 트레이딩 또는 기타 유형의 조언이나 권장 사항으로 간주되지 않으며, 트레이딩뷰에서 제공하거나 보증하는 것이 아닙니다. 자세한 내용은 이용 약관을 참조하세요.